This site uses cookies to improve your experience. To help us insure we adhere to various privacy regulations, please select your country/region of residence. If you do not select a country, we will assume you are from the United States. Select your Cookie Settings or view our Privacy Policy and Terms of Use.
Cookie Settings
Cookies and similar technologies are used on this website for proper function of the website, for tracking performance analytics and for marketing purposes. We and some of our third-party providers may use cookie data for various purposes. Please review the cookie settings below and choose your preference.
Used for the proper function of the website
Used for monitoring website traffic and interactions
Cookie Settings
Cookies and similar technologies are used on this website for proper function of the website, for tracking performance analytics and for marketing purposes. We and some of our third-party providers may use cookie data for various purposes. Please review the cookie settings below and choose your preference.
Strictly Necessary: Used for the proper function of the website
Performance/Analytics: Used for monitoring website traffic and interactions
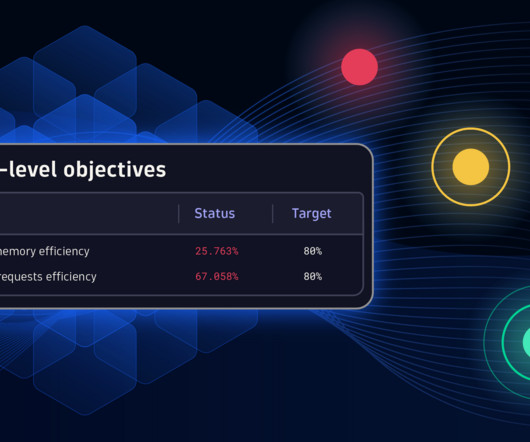
A good Kubernetes SLO strategy helps teams manage and make containerized workloads more efficient. Efficient coordination of resource usage, requests, and allocation is critical. As every container has defined requests for CPU and memory, these indicators are well-suited for efficiency monitoring.
As an executive, I am always seeking simplicity and efficiency to make sure the architecture of the business is as streamlined as possible. Here are five strategies executives can pursue to reduce tool sprawl, lower costs, and increase operational efficiency. No delays and overhead of reindexing and rehydration.
We kick off with a few topics focused on how were empowering Netflix to efficiently produce and effectively deliver high quality, actionable analytic insights across the company. DJ acts as a central store where metric definitions can live and evolve. As an example, imagine an analyst wanting to create a Total Streaming Hours metric.
Imagine you’re using a lot of OpenTelemetry and Prometheus metrics on a crucial platform. A histogram is a specific type of metric that allows users to understand the distribution of data points over a period of time. You’re gathering a lot of data, but you can’t make sense of it. What are histograms, and why use them?
DORA ( DevOps Research and Assessment ) metrics, developed by the DORA team have become a standard for measuring the efficiency and effectiveness of DevOps implementations. What Are DORA Metrics? DORA metrics are a set of four key performance indicators (KPIs) that help organizations evaluate their software delivery performance.
I realized that our platforms unique ability to contextualize security events, metrics, logs, traces, and user behavior could revolutionize the security domain by converging observability and security. Collect observability and security data user behavior, metrics, events, logs, traces (UMELT) once, store it together and analyze in context.
Second, it enables efficient and effective correlation and comparison of data between various sources. Semconv for HTTP Spans quite possibly the most important signal have been declared stable, and HTTP Metrics will hopefully soon follow. At the same time, having aligned telemetry data is crucial for adopting OpenTelemetry at scale.
For years, logs have been the dominant approach many observability vendors have taken to report business metrics on dashboards. Monitor and optimize business processes with real-time visibility into process KPIs and detailed analytics for each step to improve customer satisfaction, increase operational efficiency, and reduce cost.
Adopting AI to enhance efficiency and boost productivity is critical in a time of exploding data, cloud complexities, and disparate technologies. The Dynatrace and Microsoft partnership provides innovative solutions that enhance customer experience, improve efficiency, and generate considerable savings.
In IT and cloud computing, observability is the ability to measure a system’s current state based on the data it generates, such as logs, metrics, and traces. An advanced observability solution can also be used to automate more processes, increasing efficiency and innovation among Ops and Apps teams. What is observability?
You can now: Kickstart your creation journey using ready-made dashboards Accelerate your data exploration with seamless integration between apps Start from scratch with the new Explore interface Search for known metrics from anywhere Let’s look at each of these paths through an end-to-end use case focused on Kubernetes monitoring.
The release candidate of OpenTelemetry metrics was announced earlier this year at Kubecon in Valencia, Spain. Since then, organizations have embraced OTLP as an all-in-one protocol for observability signals, including metrics, traces, and logs, which will also gain Dynatrace support in early 2023. What’s ahead in 2023.
They now use modern observability to monitor expanding cloud environments in order to operate more efficiently, innovate faster and more securely, and to deliver consistently better business results. Further, automation has become a core strategy as organizations migrate to and operate in the cloud.
Chances are, youre a seasoned expert who visualizes meticulously identified key metrics across several sophisticated charts. Seasonal Baseline: Ideal for metrics with predictable seasonal patterns, this option leverages Davis AI to create a confidence band based on historical data, accounting for expected variations.
The emerging concepts of working with DevOps metrics and DevOps KPIs have really come a long way. DevOps metrics to help you meet your DevOps goals. Like any IT or business project, you’ll need to track critical key metrics. Here are nine key DevOps metrics and DevOps KPIs that will help you be successful.
A highly efficient Kubernetes setup generates innumerable new metrics every day, making monitoring cluster health quite challenging. You might find yourself sifting through several different metrics without being entirely sure which ones are the most insightful and warrant utmost attention.
Combined with Microsoft Sentinel, Dynatrace automation and AI capabilities provide SecOps teams with deeper intelligence to detect attacks, vulnerabilities, audit logs, and problem events based on metrics, logs, and traces it collects from monitored environments. Click here to read our full press release.
This growth was spurred by mobile ecosystems with Android and iOS operating systems, where ARM has a unique advantage in energy efficiency while offering high performance. Energy efficiency and carbon footprint outshine x86 architectures The first clear benefit of ARM in the enterprise IT landscape is energy efficiency.
With this update, Davis AI can track and alert on KPI threshold violations to assure end-to-end process efficiency and reliability. Each business unit relies on a collection of processes, and each process has metrics and KPIs that can be affected by delays, exceptions, or failures. Average duration. Custom business KPI.
The Dynatrace platform automatically captures and maps metrics, logs, traces, events, user experience data, and security signals into a single datastore, performing contextual analytics through a “power of three AI”—combining causal, predictive, and generative AI. It’s about uncovering insights that move business forward.
This demand for rapid innovation is propelling organizations to adopt agile methodologies and DevOps principles to deliver software more efficiently and securely. And how do DevOps monitoring tools help teams achieve DevOps efficiency? Provide metrics for improved site reliability. Lost efficiency. Help systems meet SLAs.
Data Explorer “test your Metric Expression” for info result coming from the above metric. Following the previous metric (above) used for the SLO, the threshold employed is an average of 100 ms for the Key Performance Indicator (KPI) of DOM Interactive. Interested in learning more? Contact us for a free demo.
Part of the problem is technologies like cloud computing, microservices, and containerization have added layers of complexity into the mix, making it significantly more challenging to monitor and secure applications efficiently. Learn more about how you can consolidate your IT tools and visibility to drive efficiency and enable your teams.
A Dynatrace API token with the following permissions: Ingest OpenTelemetry traces ( openTelemetryTrace.ingest ) Ingest metrics ( metrics.ingest ) Ingest logs ( logs.ingest ) To set up the token, see Dynatrace API – Tokens and authentication in Dynatrace documentation. If you don’t have one, you can use a trial account.
UK Home Office: Metrics meets service The UK Home Office is the lead government department for many essential, large-scale programs. From development tools to collaboration, alerting, and monitoring tools, Dimitris explains how he manages to create a successful—and cost-efficient—environment.
Even if infrastructure metrics aren’t your thing, you’re welcome to join us on this creative journey simply swap out the suggested metrics for ones that interest you. For our example dashboard, we’ll only focus on some selected key infrastructure metrics. Click on Select metric. Change it now to sum.
My goal was to provide IT teams with insights to optimize customer experience by collaborating with business teams, using both business KPIs and IT metrics. Automate smarter using actual customer experience metrics, not just server-side data. Using causal AI, we identified and resolved performance issues automatically.
This awareness allows teams to allocate and scale resources more effectively, reducing costs while ensuring CI/CD pipelines operate smoothly and efficiently. This data covers all aspects of CI/CD activity, from workflow executions to runner performance and cost metrics.
With this Google Cloud Ready integration, Dynatrace ensures that AlloyDB for PostgreSQL users can now ingest metrics along with existing Google Cloud data. The post Dynatrace announces support of Google Cloud’s AlloyDB for PostgreSQL metrics ingest appeared first on Dynatrace news.
To get a more granular look into telemetry data, many analysts rely on custom metrics using Prometheus. Named after the Greek god who brought fire down from Mount Olympus, Prometheus metrics have been transforming observability since the project’s inception in 2012.
The data lakehouse unifies the massive volume and variety of observability, security, and business data from cloud-native, hybrid, and multicloud environments while retaining data context to deliver instant, cost-efficient, and precise analytics. Dynatrace AutomationEngine.
Government agencies aim to meet their citizens’ needs as efficiently and effectively as possible to ensure maximum impact from every tax dollar invested. In contrast, observability enables teams to understand a system’s internal state by analyzing the data it generates, including logs, metrics, and traces.
The Carbon Impact app directly supports our customers sustainability efforts through granular real-time emissions reporting and analytics, translating host utilization metrics into their CO2 equivalent (CO2e). We implemented a wasted energy metric in the app to enhance practitioner actionability.
This dual-path approach leverages Kafkas capability for low-latency streaming and Icebergs efficient management of large-scale, immutable datasets, ensuring both real-time responsiveness and comprehensive historical data availability. This integration will not only optimize performance but also ensure more efficient resource utilization.
The Dynatrace platform now enables comprehensive data exploration and interactive analytics across data sets (trace, logs, events, and metrics)empowering you to solve complex use cases, handle any observability scenario, and gain unprecedented visibility into your systems.
This guide will cover how to distribute workloads across multiple nodes, set up efficient clustering, and implement robust load-balancing techniques. This leadership ensures that messages are managed efficiently, providing the fastest fail-over among replicated queue types.
This software makes the different tasks easier and allows for increased efficiency and performance. There are several software products on the market that are used for their varied applications. Development of any software is a tedious and long process, and it undergoes a series of quality and performance tests before its release and use.
The Challenge of Title Launch Observability As engineers, were wired to track system metrics like error rates, latencies, and CPU utilizationbut what about metrics that matter to a titlessuccess? The stakes are even higher when ensuring every title launches flawlessly.
As one of the most popular open-source Kubernetes monitoring solutions, Prometheus leverages a multidimensional data model of time-stamped metric data and labels. The platform uses a pull-based architecture to collect metrics from various targets. These considerations include:
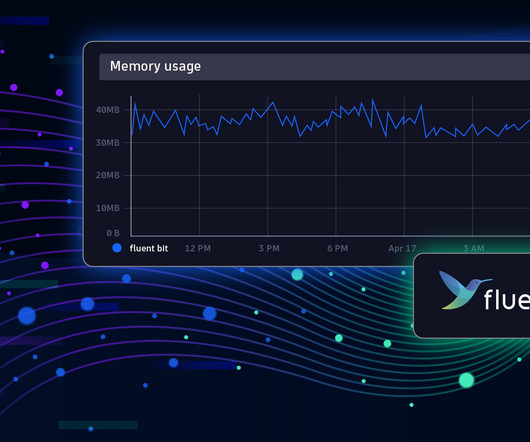
Fluent Bit is a telemetry agent designed to receive data (logs, traces, and metrics), process or modify it, and export it to a destination. Fluent Bit and Fluentd were created for the same purpose: collecting and processing logs, traces, and metrics. Observability: Elevating Logs, Metrics, and Traces! What is Fluent Bit?
Kafka scales efficiently for large data workloads, while RabbitMQ provides strong message durability and precise control over message delivery. Message brokers handle validation, routing, storage, and delivery, ensuring efficient and reliable communication. This allows Kafka clusters to handle high-throughput workloads efficiently.
Efficient coordination among resource usage, requests, and allocation is critical. It’s important to choose the right metrics to track based on your objective. As every container has defined requests for CPU and memory, these indicators are well-suited for efficiency monitoring.
You can either continue with the custom infrastructure metrics dashboard you created in Part I or use the dashboard we prepared here (Dynatrace login required). By tracking these metrics, we can identify any unusual spikes or drops in network activity, which might indicate performance issues or bottlenecks.
By leveraging Dynatrace observability on Red Hat OpenShift running on Linux, you can accelerate modernization to hybrid cloud and increase operational efficiencies with greater visibility across the full stack from hardware through application processes.
We organize all of the trending information in your field so you don't have to. Join 5,000+ users and stay up to date on the latest articles your peers are reading.
You know about us, now we want to get to know you!
Let's personalize your content
Let's get even more personalized
We recognize your account from another site in our network, please click 'Send Email' below to continue with verifying your account and setting a password.


Let's personalize your content