This site uses cookies to improve your experience. To help us insure we adhere to various privacy regulations, please select your country/region of residence. If you do not select a country, we will assume you are from the United States. Select your Cookie Settings or view our Privacy Policy and Terms of Use.
Cookie Settings
Cookies and similar technologies are used on this website for proper function of the website, for tracking performance analytics and for marketing purposes. We and some of our third-party providers may use cookie data for various purposes. Please review the cookie settings below and choose your preference.
Used for the proper function of the website
Used for monitoring website traffic and interactions
Cookie Settings
Cookies and similar technologies are used on this website for proper function of the website, for tracking performance analytics and for marketing purposes. We and some of our third-party providers may use cookie data for various purposes. Please review the cookie settings below and choose your preference.
Strictly Necessary: Used for the proper function of the website
Performance/Analytics: Used for monitoring website traffic and interactions
As modern multicloud environments become more distributed and complex, having real-time insights into applications and infrastructure while keeping data residency in local markets is crucial. This local SaaS presence minimizes latency and maximizes the speed and reliability of data access. The result?
By: Rajiv Shringi , Oleksii Tkachuk , Kartik Sathyanarayanan Introduction In our previous blog post, we introduced Netflix’s TimeSeries Abstraction , a distributed service designed to store and query large volumes of temporal event data with low millisecond latencies. Today, we’re excited to present the Distributed Counter Abstraction.
As an executive, I am always seeking simplicity and efficiency to make sure the architecture of the business is as streamlined as possible. Here are five strategies executives can pursue to reduce tool sprawl, lower costs, and increase operational efficiency. No delays and overhead of reindexing and rehydration.
Kafka scales efficiently for large data workloads, while RabbitMQ provides strong message durability and precise control over message delivery. Message brokers handle validation, routing, storage, and delivery, ensuring efficient and reliable communication. This allows Kafka clusters to handle high-throughput workloads efficiently.
Now let’s look at how we designed the tracing infrastructure that powers Edgar. If we had an ID for each streaming session then distributed tracing could easily reconstruct session failure by providing service topology, retry and error tags, and latency measurements for all service calls.
Yet, many are confined to a brief temporal window due to constraints in serving latency or training costs. These insights have shaped the design of our foundation model, enabling a transition from maintaining numerous small, specialized models to building a scalable, efficient system.
This allows teams to sidestep much of the cost and time associated with managing hardware, platforms, and operating systems on-premises, while also gaining the flexibility to scale rapidly and efficiently. In a serverless architecture, applications are distributed to meet demand and scale requirements efficiently.
This leads to a more efficient and streamlined experience for users. Lastly, monitoring and maintaining system health within a virtual environment, which includes efficient troubleshooting and issue resolution, can pose a significant challenge for IT teams.
The Challenge of Title Launch Observability As engineers, were wired to track system metrics like error rates, latencies, and CPU utilizationbut what about metrics that matter to a titlessuccess? This approach provides a few advantages: Low burden on existing systems: Log processing imposes minimal changes to existing infrastructure.
Teams also struggle with ensuring optimal resource allocation and scheduling across different OS nodes, affecting the overall efficiency of the cluster. Step 3: Deploy OneAgent on the Windows nodes for infrastructure observability To ensure infrastructure observability on Windows nodes, start by configuring and running a Dynatrace Workflow.
Citrix is a sophisticated, efficient, and highly scalable application delivery platform that is itself comprised of anywhere from hundreds to thousands of servers. OneAgent: Citrix infrastructure performance. OneAgent: SAP infrastructure performance. It delivers vital enterprise applications to thousands of users.
Vidhya Arvind , Rajasekhar Ummadisetty , Joey Lynch , Vinay Chella Introduction At Netflix our ability to deliver seamless, high-quality, streaming experiences to millions of users hinges on robust, global backend infrastructure. This model supports both simple and complex data models, balancing flexibility and efficiency.
This guide will cover how to distribute workloads across multiple nodes, set up efficient clustering, and implement robust load-balancing techniques. While clustering across wide-area networks (WANs) is discouraged due to latency issues, leased links can mitigate some connectivity challenges.
The first step is determining whether the problem originates from the application or the underlying infrastructure. Learn how Linux kernel instrumentation can improve your infrastructure observability with deeper insights and enhanced monitoring. We then calculate the run queue latency by simply subtracting the timestamps.
Its ability to densely schedule containers into the underlying machines translates to low infrastructure costs. The optimization goal was to improve the application efficiency, that is to improve the ratio between service throughput and cloud costs while not increasing the application latency (e.g. lower than 2%.).
Rajiv Shringi Vinay Chella Kaidan Fullerton Oleksii Tkachuk Joey Lynch Introduction As Netflix continues to expand and diversify into various sectors like Video on Demand and Gaming , the ability to ingest and store vast amounts of temporal data — often reaching petabytes — with millisecond access latency has become increasingly vital.
Text-based records of events and activities generated by applications and infrastructure components. Traces are used for performance analysis, latency optimization, and root cause analysis. Capture critical performance indicators such as request latency, error rates, and resource usage. Employ efficient sampling.
Endpoints include on-premises servers, Kubernetes infrastructure, cloud-hosted infrastructure and services, and open-source technologies. Observability across the full technology stack gives teams comprehensive, real-time insight into the behavior, performance, and health of applications and their underlying infrastructure.
Benefits of Caching Improved performance: Caching eliminates the need to retrieve data from the original source every time, resulting in faster response times and reduced latency. Bandwidth optimization: Caching reduces the amount of data transferred over the network, minimizing bandwidth usage and improving efficiency.
Site reliability engineering (SRE) is the practice of applying software engineering principles to operations and infrastructure processes to help organizations create highly reliable and scalable software systems. ” According to Google, “SRE is what you get when you treat operations as a software problem.”
This blog explores how vertically integrated risk management solutions that use AI and automation enable unparalleled visibility, control, and efficiency for risk management in banking. Optimize the IT infrastructure supporting risk management processes and controls for maximum performance and resilience.
Note : you might hear the term latency used instead of response time. Both latency and response time are critical to ensure reliability. Latency typically refers to the time it takes for a single request to travel from its source to its destination. Latency primarily focuses on the time spent in transit.
This is a set of best practices and guidelines that help you design and operate reliable, secure, efficient, cost-effective, and sustainable systems in the cloud. The framework comprises six pillars: Operational Excellence, Security, Reliability, Performance Efficiency, Cost Optimization, and Sustainability.
With these clear benefits, we continued to build out this functionality for more devices, enabling the same efficiency wins. This is particularly important as we build out new functionality that relies on Pushy; a strong, stable infrastructure foundation allows our partners to continue to build on top of Pushy with confidence.
Data dependencies and framework intricacies require observing the lifecycle of an AI-powered application end to end, from infrastructure and model performance to semantic caches and workflow orchestration. Estimates show that NVIDIA, a semiconductor manufacturer, could release 1.5 million AI server units annually by 2027, consuming 75.4+
To remain competitive in today’s fast-paced market, organizations must not only ensure that their digital infrastructure is functioning optimally but also that software deployments and updates are delivered rapidly and consistently. In this example, unlike latency, the remaining three signals did not receive a “pass.”
In these modern environments, every hardware, software, and cloud infrastructure component and every container, open-source tool, and microservice generates records of every activity. An advanced observability solution can also be used to automate more processes, increasing efficiency and innovation among Ops and Apps teams.
Compare Latency. On average, ScaleGrid achieves almost 30% lower latency over DigitalOcean for the same deployment configurations. In this benchmark, we measure MySQL throughput in terms of queries per second (QPS) to measure our query efficiency. Read-Intensive Latency Benchmark. Balanced Workload Latency Benchmark.
Such frameworks support software engineers in building highly scalable and efficient applications that process continuous data streams of massive volume. Failures can occur unpredictably across various levels, from physical infrastructure to software layers. This significantly increases event latency.
Site reliability engineering (SRE) is the practice of applying software engineering principles to operations and infrastructure processes to help organizations create highly reliable and scalable software systems. ” According to Google, “SRE is what you get when you treat operations as a software problem.”
Dynatrace is a launch partner in support of AWS Lambda Response Streaming , a new capability enabling customers to improve the efficiency and performance of their Lambda functions. Customers can use AWS Lambda Response Streaming to improve performance for latency-sensitive applications and return larger payload sizes.
While measuring app response time under different circumstances provides a latency value, for example, it doesn’t tell you why the app is slow, fast, or somewhere in between. Automation Based on the sheer volume and variety of data available to observability tools, IT automation is critical to ensure efficient operations.
The 2014 launch of AWS Lambda marked a milestone in how organizations use cloud services to deliver their applications more efficiently, by running functions at the edge of the cloud without the cost and operational overhead of on-premises servers. AWS continues to improve how it handles latency issues. Dynatrace news.
Dynatrace, in tandem with the Nutanix extension, simplifies performance monitoring and makes issue identification and resolution more efficient. By integrating Nutanix metrics into Dynatrace, you can gain valuable insights into the performance and health of your Nutanix infrastructure.
One of the crucial success factors for delivering cost-efficient and high-quality AI-agent services, following the approach described above, is to closely observe their cost, latency, and reliability. So, whenever the latency of the model response degrades, or the model request returns an error, Davis AI automatically detects it.
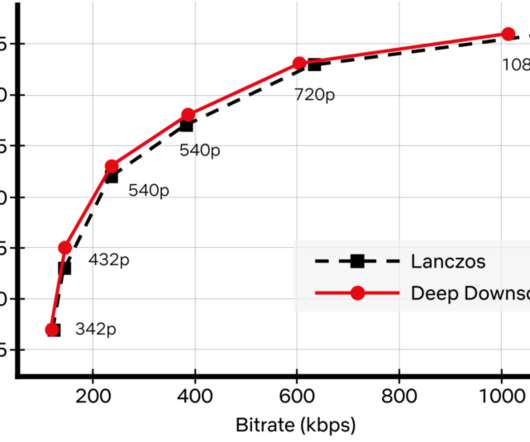
While conventional video codecs remain prevalent, NN-based video encoding tools are flourishing and closing the performance gap in terms of compression efficiency. How do we apply neural networks at scale efficiently? In order to have a viable solution, we took several steps to improve efficiency.
While data lakes and data warehousing architectures are commonly used modes for storing and analyzing data, a data lakehouse is an efficient third way to store and analyze data that unifies the two architectures while preserving the benefits of both. Data lakehouses deliver the query response with minimal latency. Data warehouses.
It supports both high throughput services that consume hundreds of thousands of CPUs at a time, and latency-sensitive workloads where humans are waiting for the results of a computation. The subsystems all communicate with each other asynchronously via Timestone, a high-scale, low-latency priority queuing system. Warm capacity.
As organizations turn to artificial intelligence for operational efficiency and product innovation in multicloud environments, they have to balance the benefits with skyrocketing costs associated with AI. The good news is AI-augmented applications can make organizations massively more productive and efficient. Use containerization.
While infrastructure has historically been treated as a bottleneck where proper scaling and compute power are applied to improve performance, these aspects are now typically addressed by hyperscalers that offer cloud-based infrastructure and infrastructure as a service.
Advances in the Industrial Internet of Things (IIoT) and edge computing have rapidly reshaped the manufacturing landscape, creating more efficient, data-driven, and interconnected factories. This proximity reduces latency and enables real-time decision-making.
Citrix is a sophisticated, efficient, and highly scalable application delivery platform that is itself comprised of anywhere from hundreds to thousands of servers. OneAgent: Citrix infrastructure performance. OneAgent: SAP infrastructure performance. Dynatrace news. Dynatrace Extension: NetScaler performance.
The data warehouse is not designed to serve point requests from microservices with low latency. Therefore, we must efficiently move data from the data warehouse to a global, low-latency and highly-reliable key-value store. Bulldozer abstracts the underlying infrastructure on how the data moves.
ITOps is an IT discipline involving actions and decisions made by the operations team responsible for an organization’s IT infrastructure. Besides the traditional system hardware, storage, routers, and software, ITOps also includes virtual components of the network and cloud infrastructure. What is ITOps?
We organize all of the trending information in your field so you don't have to. Join 5,000+ users and stay up to date on the latest articles your peers are reading.
You know about us, now we want to get to know you!
Let's personalize your content
Let's get even more personalized
We recognize your account from another site in our network, please click 'Send Email' below to continue with verifying your account and setting a password.


Let's personalize your content