This site uses cookies to improve your experience. To help us insure we adhere to various privacy regulations, please select your country/region of residence. If you do not select a country, we will assume you are from the United States. Select your Cookie Settings or view our Privacy Policy and Terms of Use.
Cookie Settings
Cookies and similar technologies are used on this website for proper function of the website, for tracking performance analytics and for marketing purposes. We and some of our third-party providers may use cookie data for various purposes. Please review the cookie settings below and choose your preference.
Used for the proper function of the website
Used for monitoring website traffic and interactions
Cookie Settings
Cookies and similar technologies are used on this website for proper function of the website, for tracking performance analytics and for marketing purposes. We and some of our third-party providers may use cookie data for various purposes. Please review the cookie settings below and choose your preference.
Strictly Necessary: Used for the proper function of the website
Performance/Analytics: Used for monitoring website traffic and interactions
At Logicify , we are proud to be software monitoring geeks. We love to monitor both the apps we develop and the ones we use internally. Not because they are sloppy. Not because we don’t trust our code. But because we love to keep abreast of events, control performance and eliminate the risks of an error. Monitoring helps us be proactive and avert issues before real users are affected.
Reading time 4 min What do the Simpsons have to do with web performance? Stay with us – it’s not that much of a stretch. When you’re looking to build a culture of performance, you often need to find a common language so you can talk to the business teams about what matters most to them. You’ll typically want to find a way to make a connection between a performance metric (such as First Meaningful Paint) and a business metric (Conversion Rate).
I’m lucky to be able to work with a wide variety of organizations and teams, with different architectures and workflows. I like it. It keeps things fresh. I sometimes find it’s nice to have a version of their site running locally to make it easier for me to dig deeper and test different optimizations. I see a lot of similar tech-stacks between my clients nowadays.
Dynatrace news. Dynatrace and xMatters have teamed up to help organizations meet the challenges of their increasingly complex enterprise cloud environments. Our out-of-the-box xMatters integration automates and closes the feedback loop between Dev and Ops, allowing for automatic push notifications from Dynatrace to xMatters environments. This enables the timely routing of critical information to the responsible team members.
Before we get into the tutorial hands-on, I would like to mention that this topic is not new. It has been covered in various helpful articles like the ones from TestAutomationGuru. The content which I am about to present has its custom favors and solves specific issues that I have encountered while working with this setup.
Wake up! It's HighScalability time—once again: The Apollo 11 guidance computer repeatedly crashed on descent. On earth computer scientists had just 13 hours to debug the problem. They did. It was CPU overload because of a wrong setting. Some things never change! Do you like this sort of Stuff? I'd greatly appreciate your support on Patreon. I wrote Explain the Cloud Like I'm 10 for people who need to understand the cloud.
Reading time 4 min What does The Simpsons have to do with web performance? Stay with us – it’s not that much of a stretch. When you’re looking to build a culture of performance, you often need to find a common language so you can talk to the business teams about what matters most to them. You’ll typically want to find a way to make a connection between a performance metric (such as First Meaningful Paint ) and a business metric (Conversion Rate).
Dynatrace news. We’re up-leveling the life cycle stages of Dynatrace capabilities and features in order to provide faster time to value for our customers. More capabilities will be released faster to General Availability (GA). We’re constantly working to provide as much value as possible to our customers. One element of our customers’ (and our own) success is the speed of innovation at which we operate.
Sign up to get articles personalized to your interests!
Technology Performance Pulse brings together the best content for technology performance professionals from the widest variety of industry thought leaders.
Dynatrace news. We’re up-leveling the life cycle stages of Dynatrace capabilities and features in order to provide faster time to value for our customers. More capabilities will be released faster to General Availability (GA). We’re constantly working to provide as much value as possible to our customers. One element of our customers’ (and our own) success is the speed of innovation at which we operate.
With all the benefits that microservices architecture and cloud-native and serverless applications bring, they also add a lot of complexity from an operations point of view. To successfully support and manage these applications, it has become very important to have full visibility into these distributed applications. Application monitoring practices as we currently use the are no longer sufficient.
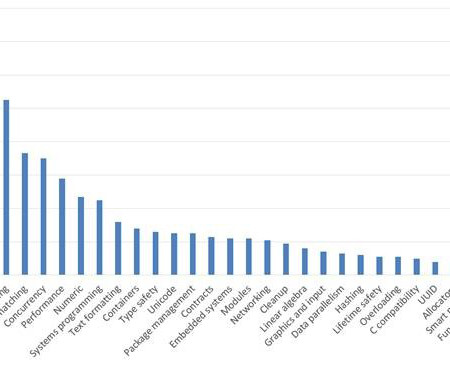
Today I collated and analyzed the results of the survey I posted two weeks ago. I presented you with a daunting unsorted list of ~300 eye-numbing paper titles , and still 289 of you responded with ~1,200 total votes (not everyone picked five things) many of which contained thoughtful “how I would use it” verbatims. Thank you for your time and interest!
Dynatrace news. “Use the Artificial Intelligence”, it is not a Jedi Trick. Old School monitoring. I have worked on many accounts where Dynatrace replaced tools such as Nagios and Solarwinds. Basically, what we call “first-generation” monitoring software. These older tools require a lot of manual effort to set up correctly, especially when configuring alerts.
Although we all have to deal with unexpected events, we also have tools to prevent them. Like mentioned in the last post , log files must be accessible upfront; otherwise. troubleshooting is compromised. Before any issue occurs, there’s a lot we can do in order to be aware of what’s going on, act proactively, and don’t let the problem become reality.
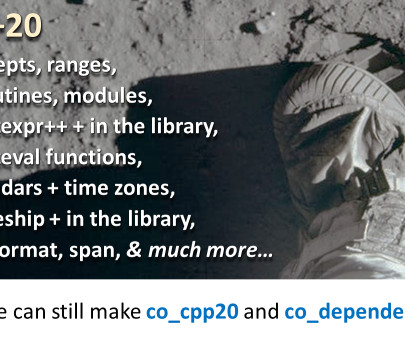
Obligatory comment: The C++20 Eagle has wings. At noon today, July 20 2019, the ISO C++ committee completed its summer meeting in Cologne, Germany, hosted with thanks by Think-Cell, SIGS Datacom, SimuNova, Silexica, Meeting C++, Josuttis Eckstein, Xara, Volker Dörr, Mike Spertus, and the Standard C++ Foundation. As usual, we met for six days Monday through Saturday, and it was our biggest meeting yet with some 220 attendees.
Effect of removing CPU constraints and maintaining data locality on a running DB instance. In this video I migrate a Postgres DB running PGbench benchmark. The DB is running on a Host which is CPU constrained. Once the VM is migrated to a less busy host the transaction rate immediately increases from ~15,000 to ~20,000. As the DB continues to run on the new host – the Nutanix storage detects the access patterns and “localizes” the data that the DB is accessing.
Dynatrace news. Python is the fastest-growing major programming language today. Web development and data science are the two main types of Python development. The two most popular web frameworks used by Python developers are Django and Flask. When comparing Django and Flask , developers like to highlight that Django provides an all-inclusive experience for developers: you get an admin panel, database interfaces, ORM, and directory structure for your applications and projects out of the box.
There are a few distinct differences and subtle nuances between 32-bit JVM and 64-bit JVM. We thought we will try to clarify them through this question-and-answer article. Do I need to understand the difference between 32-bit JVM and 64-bit JVM? If you aren’t building a performance-critical application, you don’t have to understand the difference. The subtle difference between 32-bit JVM and 64-bit JVM wouldn’t make much difference to your application.
How do we break a large system into smaller, more manageable modular components? This is the question I get asked the most, so I’ve put together this article describing a workshop recipe you can use. In Domain-Driven Design, a large system is decomposed into bounded contexts , which become natural boundaries in code as microservices and as teams in the organisation.
This article is from my friend Ben who runs Calibre , a tool for monitoring the performance of websites. We use Calibre here on CSS-Tricks to keep an eye on things. In fact, I just popped over there to take a look and was notified of some little mistakes that slipped by, and I fixed them. Recommended! In this article, we uncover how PageSpeed calculates it’s critical speed score.
When it comes to organising engineering teams, a popular view has been to organise your teams based on either Spotify's agile model (i.e. squads, chapters, tribes, and guilds) or simply follow Amazon's two-pizza team model. On a positive note, both organisational models focus on having small yet productive independent cross-functional teams and there is nothing wrong to draw inspiration from either of these models when building your engineering organisation.
Python is becoming the most widely used programming language. Different Types of Testing. Unit Test — you can picture this being at the bottom of the pyramid. It is mostly used to pinpoint bugs in your code. It cannot be used for integration testing, unit tests should essentially just give the function that’s tested some inputs, and then check what the function outputs are correct.
Starting at version MySQL5.6+ by default innodb_file_per_table is enabled and all data is stored in separate tablespaces. It provides some advantages. I will highlight some of them: You can reclaim disk space when truncating or dropping a table stored in a file-per-table tablespace. Truncating or dropping tables stored in the shared system tablespace creates free space internally in the system tablespace data files (ibdata files) which can only be used for new InnoDB data.
Tasktop Integration Hub version 19.3 was released today, with some exciting new features including test step synchronization for ALM, artifact re-twinning, and a full scan by project. . Synchronizing Test Steps across Multiple Micro Focus ALM Instances. It’s not uncommon for organizations that use Micro Focus ALM to have multiple instances of the tool, often running different versions.
This article gives an overview of the Max Worker Threads for the SQL Server Always On Availability Group databases. SQL Server Always On Availability Group is a widely accepted feature to implement high availability and disaster recovery solution (HADR). It is available from SQL Server 2012 onwards. Please make sure you have good knowledge of […].
Whether you have moved your on-prem workload to the cloud or building a cloud-native application, monitoring becomes very important. Instead of leaving this entirely to your Ops team, I encourage both developers and architects to have a monitoring strategy while designing solutions for the cloud. In this, I am going to discuss a few tips for monitoring EC2 using CloudWatch and some important metrics to look at, so let's get started.
I can’t believe we’ve arrived at the end-of-term again already! I’ll be taking a four-week break from writing The Morning Paper, normal service resumes on Monday 19th August. A big milestone will slip quietly by during this recess – it was five years ago on the 30th July 2014 that I read and shared the very first paper in this current streak of paper reading.
When hiring for senior roles, companies put too much stress on stakeholder management skills i.e. ability to navigate through complex stakeholder landscape and manage expectations. I find the ability to form meaningful and impactful partnership a lot more important skill than stakeholdership. So what defines partnership at the workplace and how you use it to hire the people who can create great partnerships and have a long-lasting impact on the course of your company?
In the previous part of the series, we took a closer look at the event loop model. In this article, we are going to discuss several techniques that help you to prevent event loop delays. The causes of event loop delays can be divided into two categories. The first category contains event loop delays caused by a handler calling a blocking API. The second category covers delays caused by a handler code taking a great amount of CPU time to complete.
Logging is a natural part of coding. Believe it or not, we’ve all programmed logging into our code. After all, who hasn’t written a “Hello World” program? It’s not just your code that writes out log messages, every other piece of software does, from the operating system all the way up the stack. Tools to ship, aggregate and index logs have been around for a long time; it’s a mature market.
For quite some time we’ve received reports from our larger customers about a mysterious H13 - Connection closed error showing up for Ruby applications. Curiously it only ever happened around the time they were deploying or scaling their dynos. Even more peculiar, it only happened to relatively high scale applications. We couldn’t reproduce the behavior on an example app.
Recently I happen to encounter memory/space issues quite often with a server that hosts Nexus (a repository manager that almost has universal support for all formats). On digging into the issue the prima facie evidence that we got was Docker Image size of our node applications are at alarming. high (~ 2.5 GB ).
We organize all of the trending information in your field so you don't have to. Join 5,000+ users and stay up to date on the latest articles your peers are reading.
You know about us, now we want to get to know you!
Let's personalize your content
Let's get even more personalized
We recognize your account from another site in our network, please click 'Send Email' below to continue with verifying your account and setting a password.


Let's personalize your content