This site uses cookies to improve your experience. To help us insure we adhere to various privacy regulations, please select your country/region of residence. If you do not select a country, we will assume you are from the United States. Select your Cookie Settings or view our Privacy Policy and Terms of Use.
Cookie Settings
Cookies and similar technologies are used on this website for proper function of the website, for tracking performance analytics and for marketing purposes. We and some of our third-party providers may use cookie data for various purposes. Please review the cookie settings below and choose your preference.
Used for the proper function of the website
Used for monitoring website traffic and interactions
Cookie Settings
Cookies and similar technologies are used on this website for proper function of the website, for tracking performance analytics and for marketing purposes. We and some of our third-party providers may use cookie data for various purposes. Please review the cookie settings below and choose your preference.
Strictly Necessary: Used for the proper function of the website
Performance/Analytics: Used for monitoring website traffic and interactions
A key learning from the outage caused by the faulty CrowdStrike “Rapid Response” update is how critical it is to understand your vendors’ quality control and release processes. Vendors should not only offer advanced technology to fulfill a business requirement but also demonstrate a strong commitment to reliability, security, and customer support. A variety of events and circumstances can cause an outage.
In this insightful Q&A, Goutham Veeramachaneni , a long-time Prometheus maintainer and Product Manager at Grafana Labs , shares his unique perspective on the transformative impact of OpenTelemetry (OTel) in the observability landscape. Veeramachaneni discusses how OTel is standardizing telemetry data and inspiring new open-source data collectors and workflows that bridge the gap between application and infrastructure monitoring.
In the future, computers will not crash due to bad software updates, even those updates that involve kernel code. In the future, these updates will push eBPF code. Friday July 19th provided an unprecedented example of the inherent dangers of kernel programming, and has been called the largest outage in the history of information technology. Windows computers around the world encountered blue-screens-of-death and boot loops, causing outages for hospitals, airlines, banks, grocery stores, media br
pt-online-schema-change is an amazing tool for assisting in table modifications in cases where ONLINE ALTER is not an option. But if you have foreign keys, this could be an interesting and important read for you. Tables with foreign keys are always complicated, and they have to be handled with care.
As we did with IBM Power , we’re delighted to share that IBM and Dynatrace have joined forces to bring the Dynatrace Operator, along with the comprehensive capabilities of the Dynatrace platform, to Red Hat OpenShift on the IBM Z and LinuxONE architecture (s390x). IBM Z and LinuxONE mainframes running the Linux operating system enable you to respond faster to business demands, protect data from core to cloud, and streamline insights and automation.
In my previous article, Managing Architectural Tech Debt , I talked about understanding and managing architectural technical debt. Architectural technical debt is the often ignored, but ironically one of the most damaging , categories of technical debt. In this article, I want to dive deeper into one way to manage architectural technical debt (and technical debt as a whole) — architectural observability ( AO ).
Explore Odin, Uber’s stateful platform for managing all types of databases. It is a technology-agnostic, intent-based system that has dramatically improved the operational throughput of underlying hosts and databases company-wide.
A couple of weeks ago, my colleague Marco Tusa published an important announcement titled “Do Not Upgrade to Any Version of MySQL After 8.0.37.” The announcement highlighted a critical issue in MySQL 8.0.38, MySQL 8.4.1, and MySQL 9.0.0 that caused database server crashes. Good news!
Sign up to get articles personalized to your interests!
Technology Performance Pulse brings together the best content for technology performance professionals from the widest variety of industry thought leaders.
A couple of weeks ago, my colleague Marco Tusa published an important announcement titled “Do Not Upgrade to Any Version of MySQL After 8.0.37.” The announcement highlighted a critical issue in MySQL 8.0.38, MySQL 8.4.1, and MySQL 9.0.0 that caused database server crashes. Good news!
In an era where customer expectations are higher than ever, avoiding outages and failures during software deployments is critical for maintaining trust and satisfaction. Traditional deployment techniques that roll out updates or patches directly into full production can present significant risks and lead to potential downtime. Modern deployment techniques using progressive delivery—such as rolling, blue/green, canary, and feature flagging—offer a more controlled and gradual approach to releasing
Are you ready to start your journey on the road to collecting telemetry data from your applications? Great observability begins with great instrumentation! In this series, you'll explore how to adopt OpenTelemetry (OTel) and how to instrument an application to collect tracing telemetry. You'll learn how to leverage out-of-the-box automatic instrumentation tools and understand when it's necessary to explore more advanced manual instrumentation for your applications.
From WWDC reveal to delivery, discover how we tackled new tech, design challenges, and tight timelines to enhance rider & driver experiences with Live Activity® from Apple.
Discover the various types of performance testing and understand their unique benefits. Learn about load, stress, throttle, peak, and scalability tests, and see how each one plays a vital role in boosting your systems to run smoothly and efficiently. Performance testing is a part of. The post Types of Performance Testing appeared first on Blog about Software Development, Testing, and AI | Abstracta.
After a decade of helping companies manage container orchestration, Kubernetes, the open source container platform, has established itself as a mature enterprise technology. According to the Cloud Native Computing Foundation (CNCF), 84% of organizations are using or evaluating Kubernetes , up from 81% in 2022. But challenges remain when it comes to Kubernetes complexity.
In today's AI era, the architecture of AI systems is becoming increasingly complex, making its stability, resource utilization, and fault self-healing capabilities increasingly important. Addressing issues only when they occur during actual operation not only incurs high costs but also affects user experience. Chaos engineering is about proactively exposing and addressing system vulnerabilities, greatly enhancing system resilience.
Mission-critical applications require great performance without breaking the bank. In this light, we are always seeking to prove Volt’s value against other data platforms for supporting applications that need to be fast without compromising on things like accuracy, consistency, or resiliency. As part of our new support for ARM processors , we recently ran benchmarks on both Intel C7 and ARM c7g on AWS.
Dive into the core of performance testing metrics and discover the importance of accurate analysis in ensuring optimal system performance. Through simple explanations, we will guide you toward making informed decisions in your testing endeavors and identifying performance bottlenecks. Unlocking the full potential of performance. The post 3 Key Performance Testing Metrics Every Tester Should Know appeared first on Blog about Software Development, Testing, and AI | Abstracta.
If you work in software development, SRE, or DevOps, you’ve likely heard the terms observability, telemetry, and tracing. These concepts are crucial for understanding how applications behave in production environments, and they’re an essential part of modern software development practices. You’ve also likely heard OpenTelemetry mentioned in the context of observability.
An architectural pattern named Event Sourcing is gaining more and more recognition from developers who aim for strong and scalable systems. In this article, we’ll take a closer look at the concept of it: what it entails, its benefits, general flow, and key concepts. Moreover, we will discuss how to implement ES — some details on the technologies that make adoption easy.
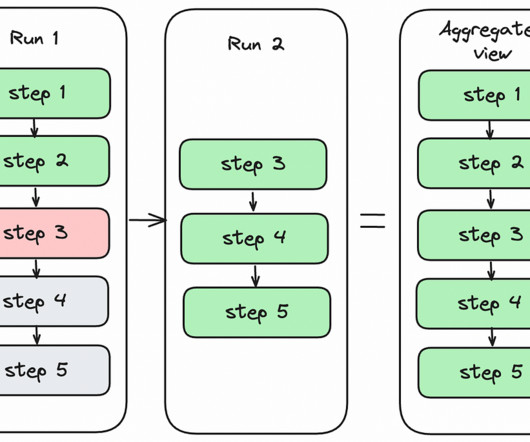
By Jun He , Natallia Dzenisenka , Praneeth Yenugutala , Yingyi Zhang , and Anjali Norwood TL;DR We are thrilled to announce that the Maestro source code is now open to the public! Please visit the Maestro GitHub repository to get started. If you find it useful, please give us a star. What is Maestro Maestro is a general-purpose, horizontally scalable workflow orchestrator designed to manage large-scale workflows such as data pipelines and machine learning model training pipelines.
One of the most common pain-points I hear from companies is that they spent a bunch of time chasing an optimization, only to find that, after shipping it, they could provide no evidence of it making a difference in their performance. There are a lot of things involved in making performance more predictable, but one immediate thing you can do is do the work up front to set expectations about which metrics you expect the optimization to move, and how you’ll measure the impact.
Something not working as expected? Not sure what an error message means? At Dynatrace, we’re committed to helping you get the most out of observability and security to keep your software working perfectly. The perfect place to start is the Dynatrace troubleshooting community forum. What is the Dynatrace troubleshooting community? The Dynatrace troubleshooting community is a website that hosts articles written by Dynatrace experts with quick answers to common issues.
We have released Dynatrace Managed version 1.296. To learn what’s new, have a look at the release notes. The post Dynatrace Managed release notes version 1.296 appeared first on Dynatrace news.
A zero trust architecture (ZTA) model comprises seven pillars to enhance the security posture of all organizations, from government agencies to private sector enterprises. ZTA is a set of system design principles with a security model in mind. It includes an advanced cybersecurity strategy because threats can come from inside or outside of a network boundary.
We organize all of the trending information in your field so you don't have to. Join 5,000+ users and stay up to date on the latest articles your peers are reading.
You know about us, now we want to get to know you!
Let's personalize your content
Let's get even more personalized
We recognize your account from another site in our network, please click 'Send Email' below to continue with verifying your account and setting a password.


Let's personalize your content