This site uses cookies to improve your experience. To help us insure we adhere to various privacy regulations, please select your country/region of residence. If you do not select a country, we will assume you are from the United States. Select your Cookie Settings or view our Privacy Policy and Terms of Use.
Cookie Settings
Cookies and similar technologies are used on this website for proper function of the website, for tracking performance analytics and for marketing purposes. We and some of our third-party providers may use cookie data for various purposes. Please review the cookie settings below and choose your preference.
Used for the proper function of the website
Used for monitoring website traffic and interactions
Cookie Settings
Cookies and similar technologies are used on this website for proper function of the website, for tracking performance analytics and for marketing purposes. We and some of our third-party providers may use cookie data for various purposes. Please review the cookie settings below and choose your preference.
Strictly Necessary: Used for the proper function of the website
Performance/Analytics: Used for monitoring website traffic and interactions
Understanding that the first mile of getting data in can often be the hardest, Dynatrace continues to invest in log ingest, offering a range of out-of-the-box solutions within the Dynatrace Platform and apps. We’re excited to announce several log management innovations, including native support for Syslog messages, seamless integration with AWS Firehose, an agentless approach using Kubernetes Platform Monitoring solution with Fluent Bit, a new out-of-the-box ingest dashboard, and OpenPipeline in
Are you ready to get started with cloud-native observability and telemetry pipelines? This article is part of a series exploring a workshop guiding you through the open source project Fluent Bit, what it is, a basic installation, and setting up the first telemetry pipeline project. Learn how to manage your cloud-native data from source to destination using the telemetry pipeline phases covering collection, aggregation, transformation, and forwarding from any source to any destination.
Managing High Availability (HA) in your PostgreSQL hosting is very important to ensuring your database deployment clusters maintain exceptional uptime and strong operational performance so your data is always available to your application. In an earlier blog post, we introduced you to configure high availability for PostgreSQL using streaming replication , and now we’re going to show you how to best manage client-side HA.
Database novices often wonder how ‘things work behind the scenes’ when starting with PostgreSQL. Many things happen when creating a table and adding data that are not apparent. You might ask, ‘Where does the data go?’ Luckily, it is easy to discover the details.
In today’s complex digital landscape, protecting your organization from cyber threats is more crucial than ever. Highly distributed multicloud systems and an ever-changing threat landscape facilitate potential vulnerabilities going undetected, putting organizations at risk. A robust application security strategy is vital to ensuring the safety of your organization’s data and applications.
Numerous AI projects launched with promise fail to set sail. This is not usually because of the quality of the machine learning (ML) models. Poor implementation and system integration sink 90% of projects. Organizations can save their AI endeavors. They should adopt adequate MLOps practices and choose the right set of tools. This article discusses MLOps practices and tools that can save sinking AI projects and boost robust ones, potentially doubling project launch speed.
In the years immediately following the dot-com meltdown, there was more tech labor than there were tech jobs. That didn’t last long. By 2005, the tech economy had bounced back on its own. After that, the emergence of mobile (a new and lucrative category of tech) plus low interest rate policy by central banks fueled demand for tech. Before the first decade of the century was out, “tech labor scarcity” became an accepted norm.
You might have driven a car, but have you ever wondered how the engine works? Similarly if you have used Kubernetes and if you are interested to know how a pod works, this blog post is the right place to start with.
Sign up to get articles personalized to your interests!
Technology Performance Pulse brings together the best content for technology performance professionals from the widest variety of industry thought leaders.
You might have driven a car, but have you ever wondered how the engine works? Similarly if you have used Kubernetes and if you are interested to know how a pod works, this blog post is the right place to start with.
The world is more connected than ever before. With global e-commerce spending projected to reach $6.3 trillion this year 1 , more than two-thirds of the adult population now relying on digital payments 2 for financial transactions, and more than 400 million terabytes of data being created each day 3 , it’s abundantly clear that the world now runs on software.
High-performance computing systems often use all-flash architectures and kernel-mode parallel file systems to satisfy performance demands. However, the increasing sizes of both data volumes and distributed system clusters raise significant cost challenges for all-flash storage and vast operational challenges for kernel clients. JuiceFS is a cloud-native distributed file system that operates entirely in user space.
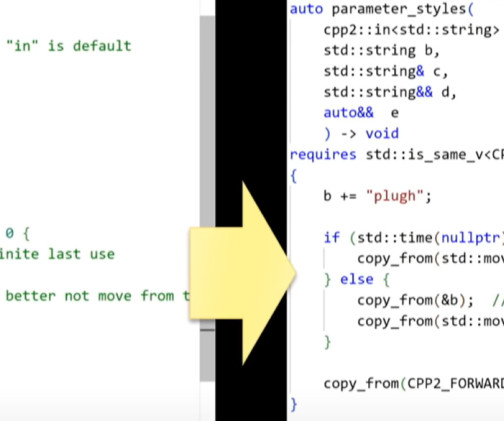
Here’s a super simple question: “How do I write a parameter that accepts any non- const std::istream argument? I just want an istream I can read from.” (This question isn’t limited to streams, but includes any similar type you have to modify/traverse to use.) Hopefully the answer will be super simple, too! So, before reading further: What would be your answer?
I still remember upgrading a Kubernetes cluster for the first time. Despite taking great care and following all the documentation, I managed to break some applications. Luckily, the impact was minimal, and the issue was solved quickly.
With today’s ever-changing software development world, there has never been much demand for top-notch software like nowadays. The complexity of applications calls upon traditional software.
Model performance has to be evaluated in machine learning and data science in order to come up with a model that is reliable, accurate, and efficient in making any kind of prediction. Some common tools for this are the Confusion Matrix and the ROC Curve. Both have different purposes and knowing exactly when to use them is critical in robust model evaluation.
This article is, in fact, two topics merged into one publication. Both are related to anonymous statistical data collection within Percona releases of database engines: MySQL, MongoDB, and PostgreSQL. In the first part of this article, I will share some of our findings and observations and discuss the various conclusions we have drawn from them.
We organize all of the trending information in your field so you don't have to. Join 5,000+ users and stay up to date on the latest articles your peers are reading.
You know about us, now we want to get to know you!
Let's personalize your content
Let's get even more personalized
We recognize your account from another site in our network, please click 'Send Email' below to continue with verifying your account and setting a password.


Let's personalize your content