This site uses cookies to improve your experience. To help us insure we adhere to various privacy regulations, please select your country/region of residence. If you do not select a country, we will assume you are from the United States. Select your Cookie Settings or view our Privacy Policy and Terms of Use.
Cookie Settings
Cookies and similar technologies are used on this website for proper function of the website, for tracking performance analytics and for marketing purposes. We and some of our third-party providers may use cookie data for various purposes. Please review the cookie settings below and choose your preference.
Used for the proper function of the website
Used for monitoring website traffic and interactions
Cookie Settings
Cookies and similar technologies are used on this website for proper function of the website, for tracking performance analytics and for marketing purposes. We and some of our third-party providers may use cookie data for various purposes. Please review the cookie settings below and choose your preference.
Strictly Necessary: Used for the proper function of the website
Performance/Analytics: Used for monitoring website traffic and interactions
CI/CD and Its Importance We all know what CI/CD is and how it fosters a sense of collaboration among teams and enables them to deliver high-quality software efficiently and reliably. By automating the integration, testing , and deployment processes, CI/CD helps maintain code quality, reduce manual effort, and provide continuous feedback, ultimately leading to faster and more reliable software delivery.
I’ve always been intrigued by monitoring the inner workings of technology to better understand its impact on the use cases it enables and supports. Driven by that value, Dynatrace brings real-time observability, security, and business data into context and makes sense of it so our customers can get answers, automate, predict, and prevent. Executives invest in Dynatrace to enable their IT operations, security, and development teams to maintain visibility into all their digital services an
For the longest time now, I have been obsessed with caching. I think every developer of any discipline would agree that caching is important, but I do tend to find that, particularly with web developers, gaps in knowledge leave a lot of opportunities for optimisation on the table. How does it affect you? Want to know everything (and more) about HTTP cache?
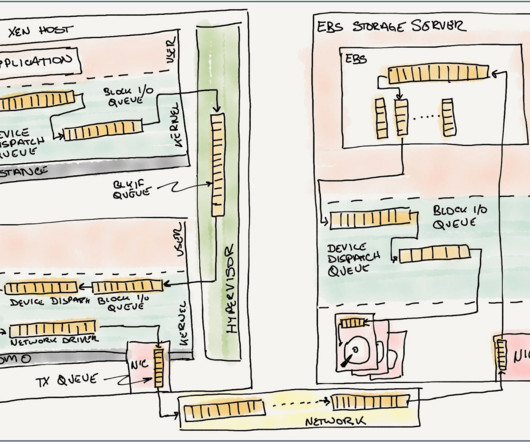
Marc Olson, a long-time Amazonian, discusses the evolution of EBS, highlighting hard-won lessons in queueing theory, the importance of comprehensive instrumentation, and the value of incrementalism versus radical changes. It's an insightful look at how one of AWS’s foundational services has evolved to meet the needs of our customers.
Having worked with over 50 Snowflake customers across Europe and the Middle East, I've analyzed hundreds of Query Profiles and identified many issues including issues around performance and cost.
The Dynatrace third-party vulnerabilities feature provides insights into vulnerable software packages by matching detected package identifiers and version numbers with known vulnerable software packages and related common vulnerabilities and exposures (CVEs). The risk of impact from an existing known vulnerability also depends on whether certain processes are using the vulnerable parts of a software component.
Percona Operator for MySQL, based on Percona XtraDB Cluster (PXC), provides configuration to expose the ProxySQL, HAProxy, and the PXC instances themselves so that you can use Percona Toolkit to connect to MySQL from these endpoints externally.
James Munro discusses ArcticDB and the practicalities of building a performant time-series datastore and why transactions, particularly the Isolation in ACID is just not worth it.
Sign up to get articles personalized to your interests!
Technology Performance Pulse brings together the best content for technology performance professionals from the widest variety of industry thought leaders.
James Munro discusses ArcticDB and the practicalities of building a performant time-series datastore and why transactions, particularly the Isolation in ACID is just not worth it.
I recently compared three OpenTelemetry approaches on the JVM: Java Agent v1, v2, and Micrometer. I used Kotlin and coroutines without overthinking. I received interesting feedback on the usage of @WithSpan with coroutines: Indeed, the @WithSpan annotation has worked flawlessly in conjunction with coroutines for some time already. However, it made me think about the underlying workings of OpenTelemetry.
Dynatrace has been named to Constellation’s annual ShortList™ of top vendors, recognized in three critical categories: Observability, AIOps, and Digital Performance Management. This underscores Dynatrace’s commitment to driving digital transformation through its end-to-end observability platform. What is the Constellation ShortList™? The Constellation ShortList™ is a portfolio of technology solutions curated by Constellation analysts to help organizations narrow their search for technologies tha
In current times, there is a high degree of focus on ensuring the availability and recovery of your production data. This can be challenging at times when using DBaaS solutions in the public cloud space, for example, when using AWS Aurora. Relying solely on a single cloud provider for database services can pose significant risks.
The insightful piece featured on InfoQ delves into the intricacies of Azure Functions’ Cold Starts, illuminating a topic frequently stirring debate within the serverless computing sphere. With the growing embrace of serverless architectures, discussions around Azure Functions’ cold starts have ignited a firestorm of controversy and given rise to numerous misconceptions.
Are you ready to start your journey on the road to collecting telemetry data from your applications? Great observability begins with great instrumentation! In this series, you'll explore how to adopt OpenTelemetry (OTel) and how to instrument an application to collect tracing telemetry. You'll learn how to leverage out-of-the-box automatic instrumentation tools and understand when it's necessary to explore more advanced manual instrumentation for your applications.
The previous blog post in this series discussed the benefits of implementing early observability and orchestration of the CI/CD pipeline using Dynatrace. This approach enhances key DORA metrics and enables early detection of failures in the release process, allowing SREs more time for innovation. This blog post explores the Reliability metric , which measures modern operational practices.
When working with MongoDB replication in environments using the WiredTiger storage engine, you may encounter data size discrepancies between PRIMARY and SECONDARY nodes. When this problem arises, the SECONDARY node uses significantly more disk space than the PRIMARY instance.
Find our Top 10 Performance Testing Tools in this article, including a balanced mix of open-source platforms and proprietary testing tools. The post Performance Testing Tools: Top 10 Picks for 2024 appeared first on Blog about Software Development, Testing, and AI | Abstracta.
Large Language Models (LLMs) are increasingly shaping the future of software development, offering new possibilities in code generation, debugging, and error resolution. Recent advancements in these AI-driven tools have prompted a closer examination of their practical applications and potential impact on developer workflows. This article explores the effectiveness of LLMs in software development, with a particular focus on error resolution.
For the 14 th consecutive time, Gartner has named Dynatrace a Leader in its 2024 Magic Quadrant for Observability Platforms. Gartner evaluated 17 vendors and positioned Dynatrace furthest for Completeness of Vision and highest for Ability to Execute. Additionally, Dynatrace ranked first in three of five Use Cases in the 2024 Gartner Critical Capabilities for Observability Platforms.
Making newer RUM metrics more actionable has been a significant priority for standards bodies. RUM has always been incredibly important for any organization focused on performance, but it’s only in the last few years that it has started to become more actionable. A big part of this shift has been better attribution so we can tell what's actually going on.
Example timings forreading a file sequentially 8k per request – after invalidating/dropping Linux filesystem caches. (echo 3 > /proc/sys/vm/drop_caches) An absolutely massive difference… What fadvise_sequential basically instructs the filesystem to read-ahead asynchronously, whereas fadvise_random does neither (similar behavior/speed was observed for ext2 and ext4 filesystems) From iostat we see this POSIX_FADV_RANDOM The iosize in iostat … The post Effect of POSIX_FADV_SEQUENTIA
Data centers use a lot of electricity. Consequently, as they grow, it becomes all the more important to understand their energy use and take steps to reduce it. Learning to measure data center power usage effectiveness (PUE) is a crucial part of that goal. What Is Data Center Power Usage Effectiveness? As its name implies, PUE measures how efficiently a data center uses the energy it consumes.
We have released Dynatrace Managed version 1.298. To learn what’s new, have a look at the release notes. The post Dynatrace Managed release notes version 1.298 appeared first on Dynatrace news.
Paper cut: (literal) A wound caused by a piece of paper or any thin, sharp material that can slice through skin. (figurative) A trivial-seeming problem that causes a surprising amount of pain. We all love big showy features, and this year we've released our share of those. But sometimes it's the small stuff that can make a big difference. We recently took a look at our backlog of smaller requests from our customers – which we labelled "paper cuts" – and decided to dedicate time to ta
React , a popular JavaScript library for building user interfaces, offers a robust way to create dynamic and responsive web applications. However, as applications grow, performance issues can arise, especially when dealing with nested component constructor calls. This article delves into how these nested constructor calls can impact React performance, providing a step-by-step detailed example, point by point, to help you understand and mitigate these issues.
We organize all of the trending information in your field so you don't have to. Join 5,000+ users and stay up to date on the latest articles your peers are reading.
You know about us, now we want to get to know you!
Let's personalize your content
Let's get even more personalized
We recognize your account from another site in our network, please click 'Send Email' below to continue with verifying your account and setting a password.


Let's personalize your content