This site uses cookies to improve your experience. To help us insure we adhere to various privacy regulations, please select your country/region of residence. If you do not select a country, we will assume you are from the United States. Select your Cookie Settings or view our Privacy Policy and Terms of Use.
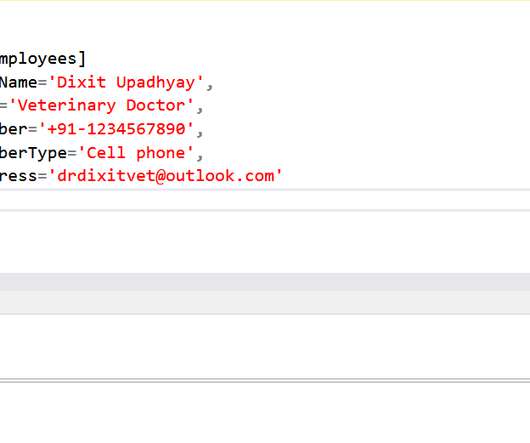
Cookie Settings
Cookies and similar technologies are used on this website for proper function of the website, for tracking performance analytics and for marketing purposes. We and some of our third-party providers may use cookie data for various purposes. Please review the cookie settings below and choose your preference.
Used for the proper function of the website
Used for monitoring website traffic and interactions
Cookie Settings
Cookies and similar technologies are used on this website for proper function of the website, for tracking performance analytics and for marketing purposes. We and some of our third-party providers may use cookie data for various purposes. Please review the cookie settings below and choose your preference.
Strictly Necessary: Used for the proper function of the website
Performance/Analytics: Used for monitoring website traffic and interactions
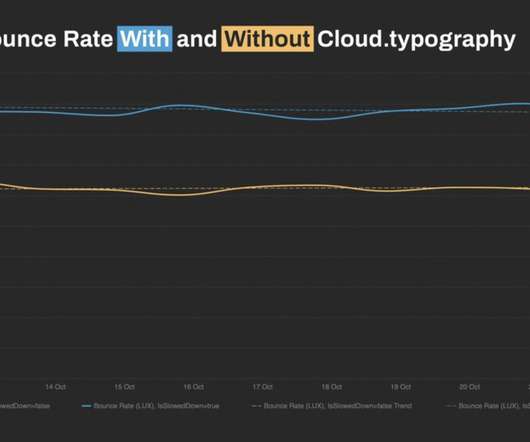
Reading time 8 min In a constantly changing environment, brands are likely to be iterating on sites and applications to make them bigger, faster, fancier, and more engaging while pushing the new and updated code out as quickly as possible. Without a set plan in place, any new script can damage performance, affecting user experience, and, therefore, business KPIs.
For the past two years, the performance.now() conference has been the most valuable performance event I've attended. So valuable, in fact, that I've made some of the talks the cornerstone of this list of performance resolutions for 2020. I'd love to know how many – if any – of these are on your list. As always, I'd love people's feedback!
Learn more about manual and automated testing! Quality is the true measure of product success. Poor user experience or application performance negates any advantages you achieve in delivery speed or production cost. Put simply, if it does not work, it is not worth producing. It is, therefore, critical to our product success that we can accurately measure and track test results to ensure our testing is delivering against our business goals.
Ever wonder how some people achieve so much in their lives while others accomplish only a fraction, even though we're all given the same amount of time in which to work?
The first metric in our Flow Metrics series is F low Velocity, a measure of productivity and one of the “money metrics”. It tells you how many items were completed over a given period of time (week or month over month). Tracking your Flow Velocity over time provides historical data for teams to see if their delivery rates have improved, helping teams to provide more accurate estimates/forecasts on how much work they can deliver.
One of the key tools that performance engineers have at their disposal is the Performance Budget: it helps us—or, more importantly, our clients—ensure that any performance-focused work is monitored and maintained after we’ve gone. By establishing an acceptable threshold, be that based on RUM data, bundle analysis, image weight, milestone timings, or any other suitable metric, we can be sure that new or unrelated bodies of work do not have a detrimental impact on the performance of our site.
The projections are in! Check out these testing trends! The software development landscape continues to evolve with DevOps and Agile development methods taking over traditional approaches. The advent of these methods has led to the innovation and use of new testing techniques. For QA professionals, it becomes crucial to quickly adapt to new changes in the testing domain so that they may become better testers and stay relevant to their industry.
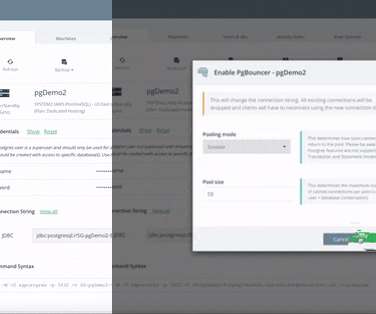
When it comes to connection pooling in the PostgreSQL world, PgBouncer is probably the most popular option. It’s a very simple utility that does exactly one thing – it sits between the database and the clients and speaks the PostgreSQL protocol, emulating a PostgreSQL server. A client connects to PgBouncer with the exact same syntax it would use when connecting directly to PostgreSQL – PgBouncer is essentially invisible.
Sign up to get articles personalized to your interests!
Technology Performance Pulse brings together the best content for technology performance professionals from the widest variety of industry thought leaders.
When it comes to connection pooling in the PostgreSQL world, PgBouncer is probably the most popular option. It’s a very simple utility that does exactly one thing – it sits between the database and the clients and speaks the PostgreSQL protocol, emulating a PostgreSQL server. A client connects to PgBouncer with the exact same syntax it would use when connecting directly to PostgreSQL – PgBouncer is essentially invisible.
Dynatrace news. Anyone moving to the cloud knows that it isn’t just a change from running servers in your data center to running them in someone else’s data center. If you’re doing it right, cloud represents a fundamental change in how you build, deliver and operate your applications and infrastructure. And that includes infrastructure monitoring. To take full advantage of all that the cloud has to offer means: Becoming more agile by breaking your monolithic applications into microservices and/o
In a constantly changing environment, brands are likely to be iterating on sites and applications to make them bigger, faster, fancier, and more engaging while pushing the new and updated code out as quickly as possible. Without a set plan in place, any new script can damage performance, affecting user. The post Debunking 5 Myths About Performance Budgets appeared first on Production.
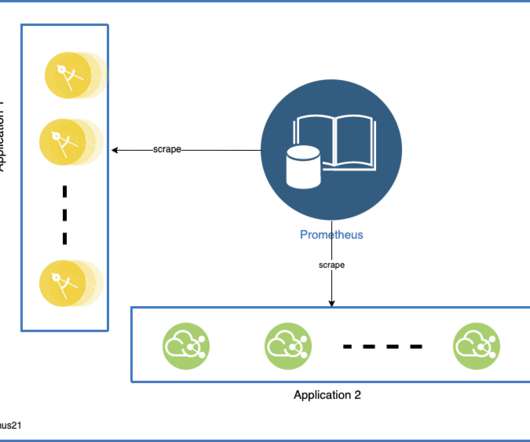
Watch out for your self-destructing apps! Prometheus is an open-source system monitoring and alerting toolkit. Data related to monitoring is stored in RAM and LevelDB nevertheless data can be stored to other storage systems such as ElasticSearch, InfluxDb, and others, [link].
Wake up! It's HighScalability time: Forrest Brazeal warns you not to spend your limited innovation credits building bespoke, complex systems that provide no direct value to your business, instead position yourself at the top of what heI calls the Wisdom/Cleverness Curve. Do you like this sort of Stuff? Your support on Patreon is appreciated more than you can know.
Dynatrace news. You asked. We listened. This year at Perform Las Vegas 2020 , we’re ramping up our Dynatrace University offerings because we know this is one of your favorite parts of attending Perform. You told us you wanted more hands-on training (HOT) Days, so you could attend more sessions, learn more about Dynatrace, and network with your fellow attendees.
Choosing the correct javascript framework for a project is an essential task for a CTO and Project Manager. However, the scope of choice largely depends on several factors like project timeline, learning curve, framework performance, and team size. This post aims to guide them in choosing the right javascript framework: React vs Vue. The post React vs Vue – The CTOs guide to Choose the Right Framework appeared first on Insights on Latest Software Technologies - Simform Blog.
The choice is yours! The choice is yours. You know your product. You know the problem it solves and why it will soon become vital to the working lives of untold numbers of users. What you might not know is how best to test that product so that your development intention becomes a product reality. There are a number of different software testing methodologies available to you to reach that reality.
Who's Hiring? Sisu Data is looking for machine learning engineers who are eager to deliver their features end-to-end, from Jupyter notebook to production, and provide actionable insights to businesses based on their first-party, streaming, and structured relational data. Apply here. T riplebyte lets exceptional software engineers skip screening steps at hundreds of top tech companies like Apple, Dropbox, Mixpanel, and Instacart.
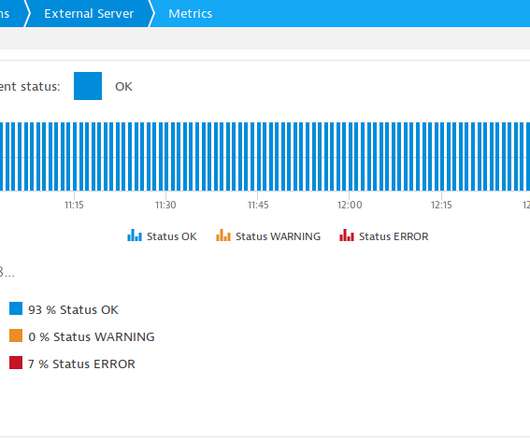
Dynatrace news. Validating Service SLAs (custom, 3 rd party or external) are a no brainer for individuals responsible for ensuring system stability and availability. It also happens to be one of the use cases Dynatrace Synthetics perfectly supports for HTTP(S) services. But what if you have services that are using other protocols? Well – keep reading and you’ll learn how Dynatrace can help you with this as well.
We need to rethink the role of the programmer. Look for the industry to become more stratified and specialized. The programming world will increasingly be split between highly trained professionals and people who don’t have a deep background but have a lot of experience building things. The former group builds tools, frameworks, languages, and platforms; the latter group connects things and builds websites, mobile apps, and the like.
How fast can it run? Nobody enjoys a long line at the supermarket or a long wait at the restaurant. Your visitors are the same. They do not appreciate slow performing websites. The worst part is, they express their displeasure through fewer sales and visits. The Impact of Slow Loading Pages — In Numbers.
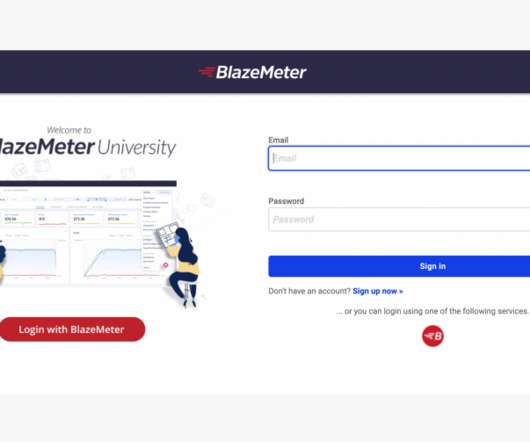
A senior performance tester’s review of the new courses by BlazeMeter Last week, I was looking for fresh knowledge on performance testing, so I asked a teammate of. The post A Quick BlazeMeter University Review appeared first on Abstracta Software Testing Services.
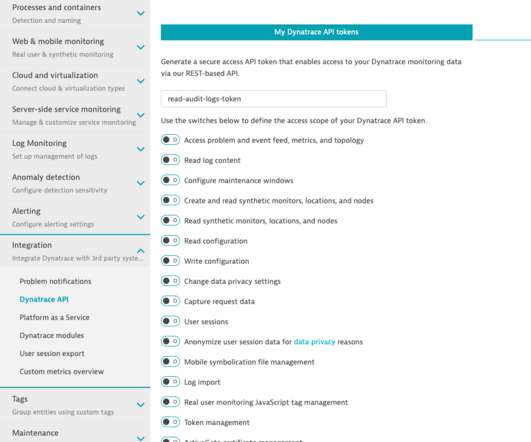
Dynatrace news. We’re happy to announce that with the release of Dynatrace 1.183, audit logs are now available for Dynatrace SaaS customers. In keeping with our API-first approach, the logs are accessible via REST API. With the new environment Audit logs API, Dynatrace SaaS and Managed customers can track changes to configurations, see who made a specific change, or what a certain configurable value was before a change.
Ironies of automation , Bainbridge, Automatica, Vol. 19, No. 6, 1983. With thanks to Thomas Depierre for the paper recommendation. Making predictions is a dangerous game, but as we look forward to the next decade a few things seem certain: increasing automation, increasing system complexity, faster processing, more inter-connectivity, and an even greater human and societal dependence on technology.
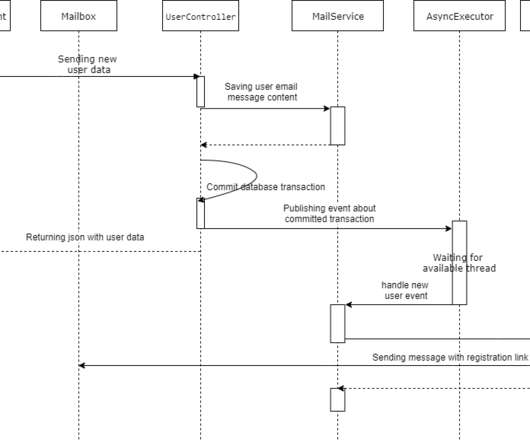
Learn more about JUnit and Byteman! Testing asynchronous operations might cause some troubles and usually requires few challenges and also code changes (even in production code). In this article, we can find how to test such operations in an application that uses spring context (with asynchronous operations enabled). We don’t have to change the production code to achieve this.
With every software enhancement, the final product that is being delivered to the customer includes the new feature as well as the existing ones. The focus of Agile teams is to maintain consistency in delivering a satisfactory final product to the customer within the timeline. This is ultimately achieved by sequencing the testing of software modules that stand important from the customer’s perspective.
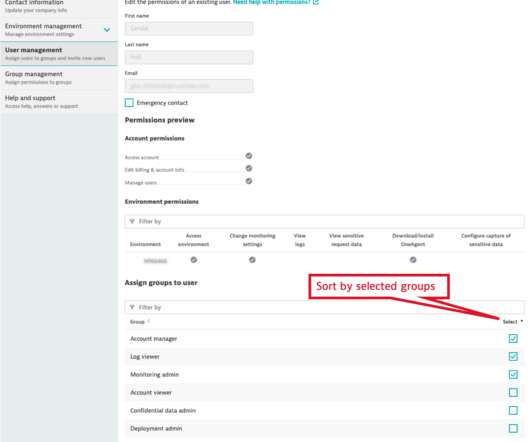
Dynatrace news. To make user management easier for our customers, we’ve improved the invitation workflow and made it simpler to see which groups a user is assigned to. Resend invitation. When you invite a new user to your account, they receive an email letting them know how to access your account. But if they miss this email, they won’t be able to access your account.
How do you find the right open-source API testing tool for your needs? Since my last roundup of the best candidates, a few more tools have appeared that warrant consideration—and there's a new technique that's all the buzz in AI automation circles that you need to know about.
This article is the second in a series on NULL complexities. Last month I introduced the NULL as SQL's marker for any kind of missing value. I explained that SQL doesn't provide you with the ability to distinguish between missing and applicable (A-values) and missing and inapplicable (I-values) markers. I also explained how comparisons involving NULLs work with constants, variables, parameters and columns.
This article explains about the sp_getapplock and sp_releaselock stored procedures and their usage with example. What is sp_getapplock The stored procedure sp_getapplock puts the lock on the application resource. Following is the syntax of the sp_getapplock: [crayon-5e17b1937e8d7489317673/] Arguments The sp_getapplock accepts the following five arguments: Resource Name The @ResourceName =’Resource_Name’ argument is the name of […].
Dynatrace news. In part one, we introduced the concept of intellectual debt, defining it as the gap between what works and our knowledge of why it works. As is often the case with technical debt, some amount of intellectual debt is acceptable, even necessary. You likely have personal stories of accidental successes, of solutions without theory; here’s one of mine.
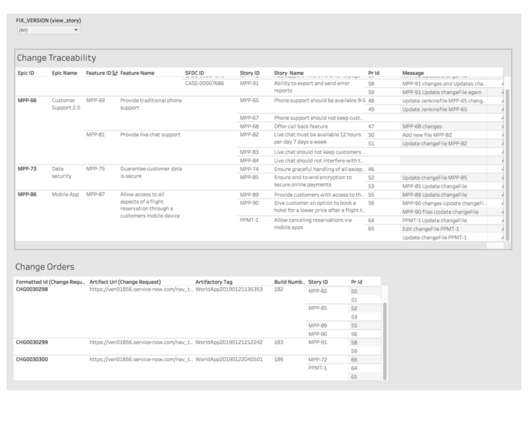
Turning software delivery data into IT and business intelligence is nothing new; it’s the 21st-century gold rush. Yet getting to this level of maturity is a herculean undertaking, especially for IT organizations looking to obtain accurate cross-tool reporting that provides them with business-critical insights into their software delivery. For many, obtaining the one source of truth into what is going on through ETL and custom reporting—chiefly in terms of compliance—is extremely labor-intensive
Earlier this week, Microsoft announced SQL Server 2019 Cumulative Update #1. The build number is 15.0.4003.23 and there are 83 fixes ! A couple of interesting fixes to me were the ones involving how well "worker stealing" — an optimization that leads to more balanced workloads — plays with other features. You can read about all the public-facing fixes in KB #4527376.
The SQL CREATE INDEX statement is used to create clustered as well as non-clustered indexes in SQL Server. An index in a database is very similar to an index in a book. A book index may have a list of topics discussed in a book in alphabetical order. Therefore, if you want to search for […].
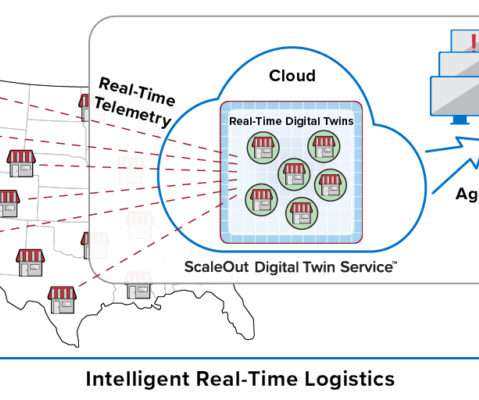
Companies with large numbers of geographically distributed assets increasingly need intelligent real-time monitoring to keep operations running smoothly. Consider a retail chain of stores or restaurants with tens of thousands of outlets. (Walgreens has more than 9,000, and McDonald’s has more than 14,000 in the U.S. alone.) Each store has mission-critical equipment, such as refrigerators and automatic doors which must operate properly at all times, as well as dynamic staffing and inventory chall
In a constantly changing environment, brands are likely to be iterating on sites and applications to make them bigger, faster, fancier, and more engaging while pushing the new and updated code out as quickly as possible. Without a set plan in place, any new script can damage performance, affecting user. The post Debunking 5 Myths About Performance Budgets appeared first on Production.
Pickerwheel is the UI element, specific to mobile devices that allows a user to pick a single value from multiple values displayed as a scrollable list. This UI element is available on both Android and iOS. Here, in this article, we will be discussing the automation of Picker Wheel specifically for iOS. How to automate PickerWheel UI element using Appium: Automation of an iOS-specific pickerWheel UI element via Appium using the XCUITest driver is quite simple.
At re:Invent in Las Vegas in December 2019, AWS announced the public preview of RDS Proxy, a fully managed database proxy that sits between your application and RDS. The new service offers to “share established database connections, improving database efficiency and application scalability” But one of the benefits that caught my eye is the ability to reduce the downtime in case of an instance failure and a failover.
Companies with large numbers of geographically distributed assets increasingly need intelligent real-time monitoring to keep operations running smoothly. Consider a retail chain of stores or restaurants with tens of thousands of outlets. (Walgreens has more than 9,000, and McDonald’s has more than 14,000 in the U.S. alone.) Each store has mission-critical equipment, such as refrigerators and automatic doors which must operate properly at all times, as well as dynamic staffing and inventory chall
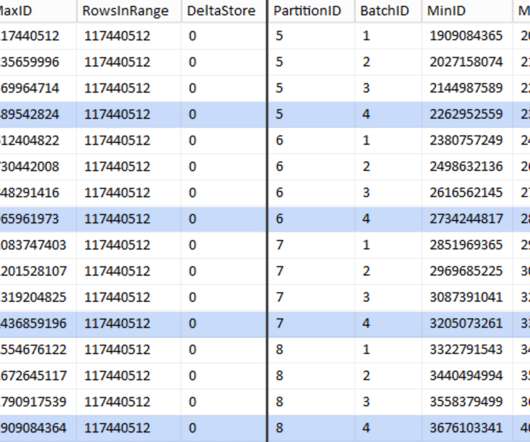
In part 1 , I showed how both page and columnstore compression could reduce the size of a 1TB table by 80% or more. While I was impressed I could shrink a table from 1TB to 50GB, I wasn't very happy with the amount of time it took (anywhere from 2 to 14 hours). With some tips graciously borrowed from folks like Joe Obbish , Lonny Niederstadt , Niko Neugebauer , and others, in this post I will try to make some changes to my original attempt to get better load performance.
We organize all of the trending information in your field so you don't have to. Join 5,000+ users and stay up to date on the latest articles your peers are reading.
You know about us, now we want to get to know you!
Let's personalize your content
Let's get even more personalized
We recognize your account from another site in our network, please click 'Send Email' below to continue with verifying your account and setting a password.


Let's personalize your content