This site uses cookies to improve your experience. To help us insure we adhere to various privacy regulations, please select your country/region of residence. If you do not select a country, we will assume you are from the United States. Select your Cookie Settings or view our Privacy Policy and Terms of Use.
Cookie Settings
Cookies and similar technologies are used on this website for proper function of the website, for tracking performance analytics and for marketing purposes. We and some of our third-party providers may use cookie data for various purposes. Please review the cookie settings below and choose your preference.
Used for the proper function of the website
Used for monitoring website traffic and interactions
Cookie Settings
Cookies and similar technologies are used on this website for proper function of the website, for tracking performance analytics and for marketing purposes. We and some of our third-party providers may use cookie data for various purposes. Please review the cookie settings below and choose your preference.
Strictly Necessary: Used for the proper function of the website
Performance/Analytics: Used for monitoring website traffic and interactions
Everything you need to know about performance engineering. Being a software developer means much more than simply writing bug-free code. As highly distributed apps become more complex, developers need to ensure their systems are as user-friendly, secure, and scalable as possible. Application performance engineering is an essential practice for any DevOps team, allowing developers across departments to stay agile and efficient.
Follower clusters are a ScaleGrid feature that allows you to keep two independent database systems (of the same type) in sync. Unlike cloning or replication, this allows you to maintain an active, point-in-time copy of your production data. This extra cluster, known as a follower cluster, can be leveraged for multiple use cases, including for analyzing, optimizing and testing your application performance for MongoDB , MySQL and PostgreSQL.
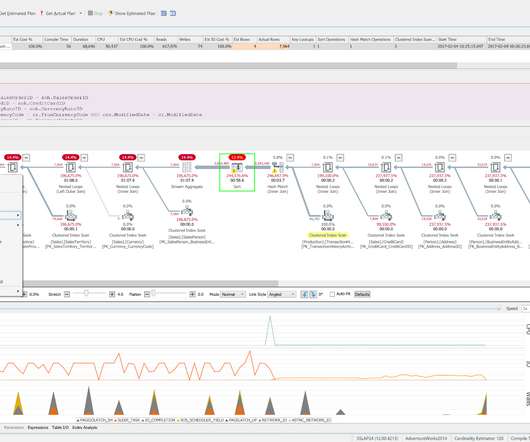
"Waitstats helps us identify performance-related counters. But waits information by itself isn't enough to accurately diagnose performance problems. The queues component of our methodology comes from Performance Monitor counters, which provide a view of system performance from a resource standpoint.". Tom Davidson, Opening Microsoft's Performance-Tuning Toolbox SQL Server Pro Magazine, December 2003.
According to the ISTQB glossary, Regression is “degradation in the quality of a component or system due to a change”. And, Regression Testing is “a type of change-related testing to detect whether defects have been introduced or uncovered in unchanged areas of the software.”. Hence, whenever there is a change in the code, we need to ensure that the previously intact and working code is still working and that the changed code has not impacted the working code in a negative way.
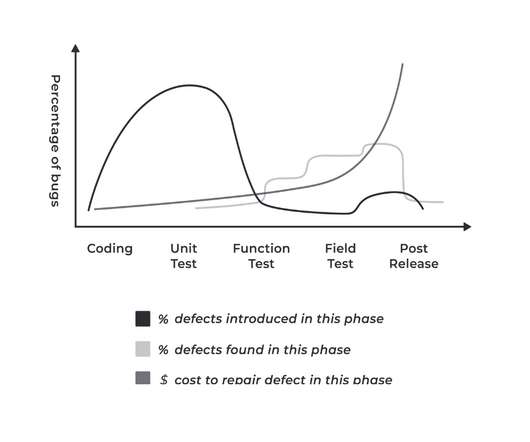
As the world has moved toward more automation, so has software testing. But if you run automated tests only at the end of your development cycle, you won't reveal all the possible issues your customers may face. Continuous testing is a great way to incorporate a wide range of testing methods early into the software development cycle.
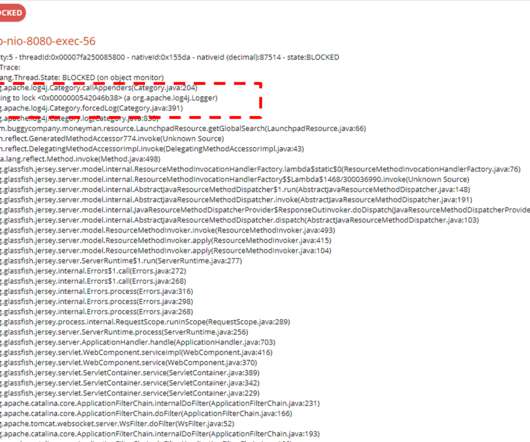
Troubleshoot your Java application, the Sherlock Holmes way. Java application failure troubleshooting can be closely associated with the typical crime scene investigation. I read few Sherlock Holmes classic stories in recent times at home, while struggling to solve the Java application failure mysteries at the office. Some of the Holmes' ways of solving the crime inspired me to do better in my troubleshooting.
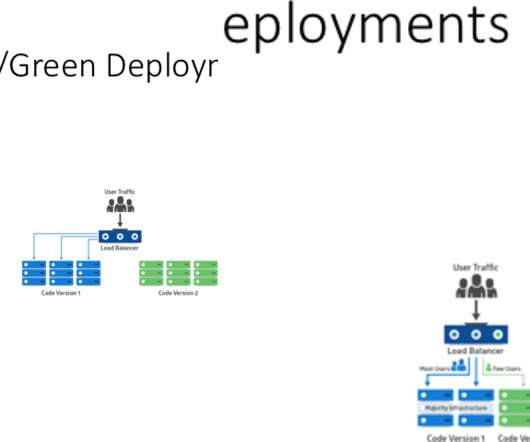
Dynatrace news. The right way to deploy canary, blue/green and feature flags. As a part of the “ Release better software faster ” breakout track at Perform Las Vegas 2020 , I’ll be presenting a session concentrating on deployment models and how to reduce risk and iterate faster. This breakout session will discuss the deployment models available for cloud implementations and how Dynatrace helps in iterating faster deployments.
Back when Jeff Bezos filled orders in his garage and drove packages to the post office himself, crunching the numbers on costs, tracking inventory, and forecasting future demand was relatively simple. Fast-forward 25 years, Amazon's retail business has more than 175 fulfillment centers (FC) worldwide with over 250,000 full-time associates shipping millions of items per day.
Sign up to get articles personalized to your interests!
Technology Performance Pulse brings together the best content for technology performance professionals from the widest variety of industry thought leaders.
Back when Jeff Bezos filled orders in his garage and drove packages to the post office himself, crunching the numbers on costs, tracking inventory, and forecasting future demand was relatively simple. Fast-forward 25 years, Amazon's retail business has more than 175 fulfillment centers (FC) worldwide with over 250,000 full-time associates shipping millions of items per day.
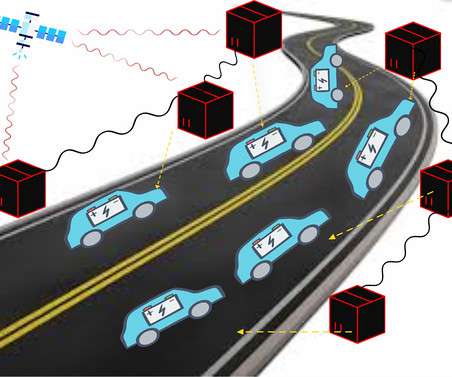
Wake up! It's HighScalability time: Instead of turning every car into rolling sensor studded supercomputers, roads could be festooned with stationary edge command and control pods for offloading compute, sensing and managing traffic. Cars become mostly remote controlled pleasure palaces. Solves compute, latency, and interop. Do you like this sort of Stuff?
Learn how to troubleshoot your application. Recently we were troubleshooting a popular SaaS application. This application was slowing down intermittently. To recover from the problem, the application had to be restarted. This application was slowing down sometimes during high traffic volume periods; sometimes during low traffic periods as well. There was no cohesive pattern.
Dynatrace news. Effective monitoring calls for effective reporting. With dashboard subscriptions and scheduled reports, available as an Early Adopter Release with version 1.184, Dynatrace now makes your life substantially easier. Turn powerful Dynatrace dashboards into custom reports with just two clicks. Dynatrace dashboards support a variety of chart visualizations and tiles.
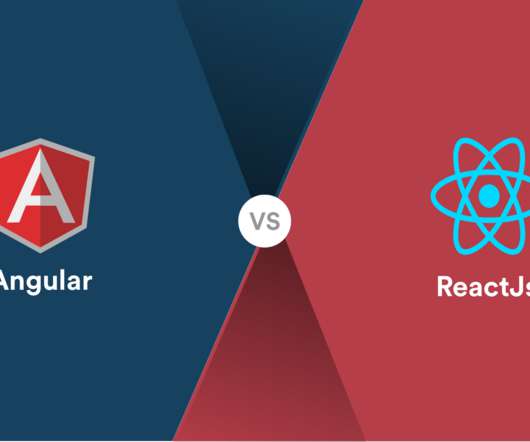
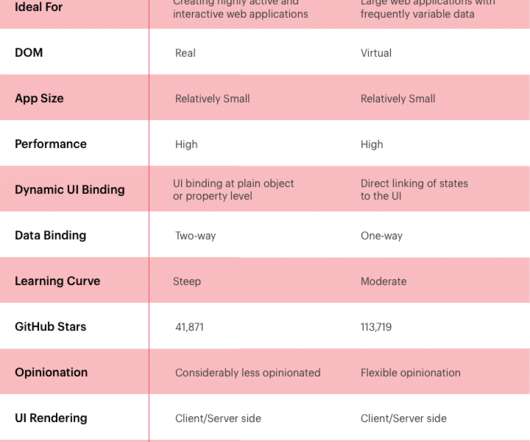
I have a love and hate relationship with all the frontend frameworks. It is quite funny or rather absurd because a lot of times, I have been getting started with the new framework, and in the middle of making a simple app, I get stuck. For weeks. . The post Angular vs React 2020 : A Comparative Guide appeared first on Insights on Latest Software Technologies - Simform Blog.
Follower clusters are a ScaleGrid feature that allows you to keep two independent database systems (of the same type) in sync. Unlike cloning or replication, this allows you to maintain an active, point-in-time copy of your production data. This extra cluster, known as a follower cluster, can be leveraged for multiple use cases, including for analyzing, optimizing and testing your application performance for MongoDB , MySQL and PostgreSQL.
What is your favorite browser testing tool? In this fast-paced software market, companies need to deliver products not just with quality but also at a rapid speed. If you are not providing the product according to customer requirements, then you might end up losing your reputation in the market. With the involvement of Agile practices, it has become highly crucial for organizations to meet the standards of software or web development.
Dynatrace news. Having released this functionality in a Preview Release back in May 2019, we’re now happy to announce the General Availability of our SAP ABAP monitoring extension. This extends Dynatrace visibility into SAP ABAP performance from the infrastructure and ABAP application platform perspective. Why SAP ABAP platform monitoring in Dynatrace?
Trade-offs under pressure: heuristics and observations of teams resolving internet service outages , Allspaw, Masters thesis, Lund University, 2015. Following on from the STELLA report , today we’re going back to the first major work to study the human and organisational side of incident management in business-critical Internet services: John Allspaw’s 2015 Masters thesis.
Who's Hiring? Sisu Data is looking for machine learning engineers who are eager to deliver their features end-to-end, from Jupyter notebook to production, and provide actionable insights to businesses based on their first-party, streaming, and structured relational data. Apply here. T riplebyte lets exceptional software engineers skip screening steps at hundreds of top tech companies like Apple, Dropbox, Mixpanel, and Instacart.
Find out more about the "perfect" test automation tool. Hello Folks, In DevOps, we usually talk about CI/CD , infra as code, containerization, performance but one of the Important and Best practices is “Automation Testing”.
Dynatrace news. Having released this functionality in a Preview Release back in October 2019, we’re now happy to announce the General Availability of our SAP ABAP real user monitoring. If you work with SAP ABAP, you may have noticed that finding information about SAP application and transaction performance involves scaling a high barrier to entry. While powerful, SAP performance management tools like the SAP Solution Manager are also complex.
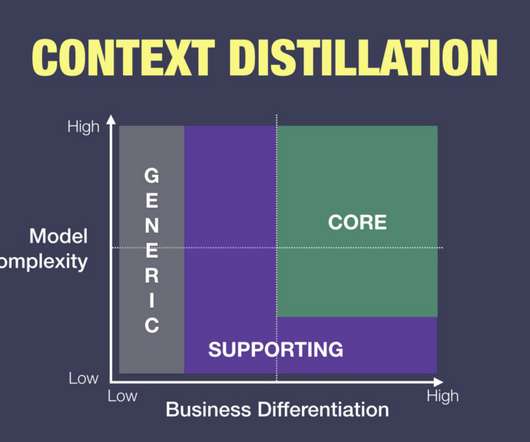
Time and resources are limited. How we spend our time and apply our resources when developing software systems is possibly the most fundamental and difficult challenge. Of all the things we could be doing, what should we do and how much quality and rigour should we invest? A natural tendency for software engineers is to gravitate towards the most technically interesting challenges.
When it comes to blogging or running any kind of brand or business, you’re going to find a certain rhythm in the activities that you do to keep it functioning. Many of these activities are simple, repetitive, and time consuming over the long term. In certain circumstances, the activities can be automated without needing your intervention. I know what you’re thinking.
Measure Java performance! From JDK-12 onwards, the JDK comes with JMH (Java Microbenchmark Harness), It is a toolkit that helps you implement Java microbenchmarks correctly. JMH is developed by the same people who implement the Java virtual machine (JVM) so they know the internals and how Java makes optimizations at run time. You may also like: JMH: Benchmark REST APIs.
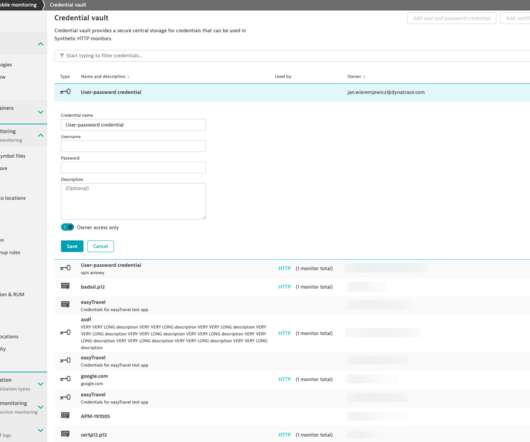
Dynatrace news. With Dynatrace Synthetic Monitoring, you can easily monitor the availability and performance of your applications as experienced by your customers around the world and around the clock. Your applications usually require authentication and authorization (user ID, password, token, or certificate) as part of the business-critical path you wish to monitor (using private or public monitors).
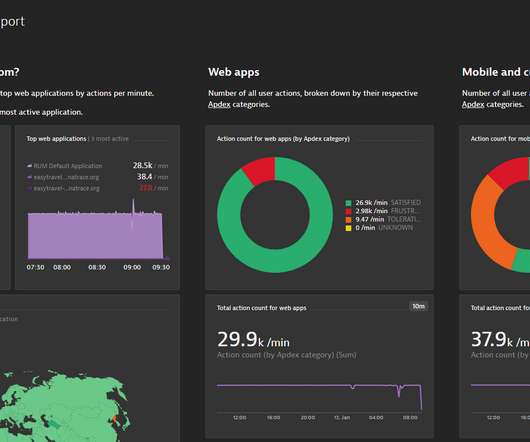
In the world of application development, there are two acronyms professionals must be familiar with to be successful: RUM and APM. These acronyms, which stand for real user monitoring and application performance monitoring, are software monitoring processes essential to measuring and evaluating applications in many different areas. Developers use APM as part of a broader strategy to ensure certain goals are met while RUM is a more narrow tool to support that strategy.
In the accelerated agile way of working, every firm demands a highly-skilled automation tester. Slowly, automation testing is replacing manual testing(though it cannot be done completely). Automation Testing is the key to the business success of the software industry. With automation, you can expand your business to a larger audience saving both time and effort.
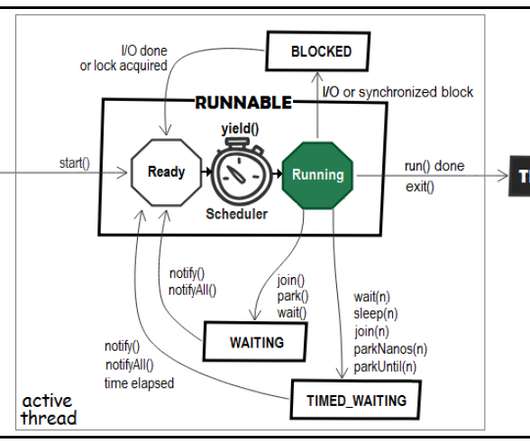
Read on to find out some Java technical interview questions! Almost any Java technical interview contains several questions covering Java concurrency topics. A common scenario for a beginner-intermediate level sound like this: Interviewer: Can you enumerate the Java thread life cycle states?
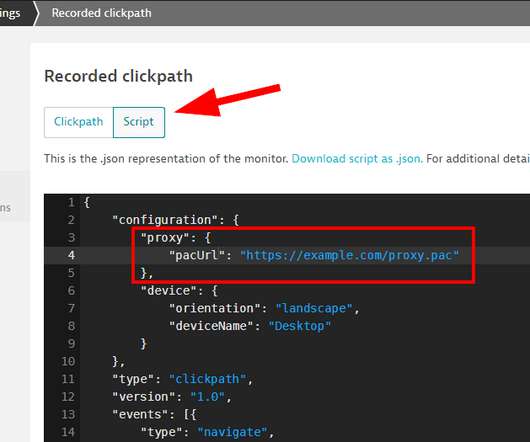
Dynatrace news. Private Synthetic locations allow you to monitor internal applications from inside your private network infrastructure. In such a setup, you often need to deal with some kind of proxy configuration. To handle complex proxy configurations, as of Dynatrace and ActiveGate versions 1.183, private browser monitors now also support Proxy Auto-Configuration (PAC) files.
I have a love and hate relationship with all the frontend frameworks. It is quite funny or rather absurd because a lot of times, I have been getting started with the new framework, and in the middle of making a simple app, I get stuck. For weeks. . The post Angularjs vs Reactjs 2020 : A Comparative Guide appeared first on Insights on Latest Software Technologies - Simform Blog.
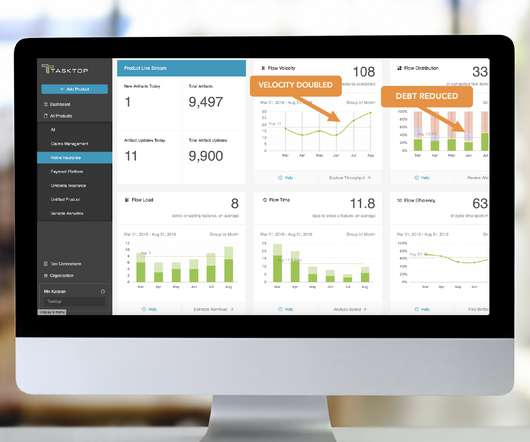
Flow time doesn’t stop the clock just because the weekend rolls around. What flow time does do is help quantify the probability of completing x percent of work in so many days – Dominica DeGrandis, author of Making Work Visible and Principal Flow Advisor at Tasktop . Every second counts in software delivery. That’s why Flow Time — the other “money metric” alongside Flow Velocity — is so important to IT and business leaders.
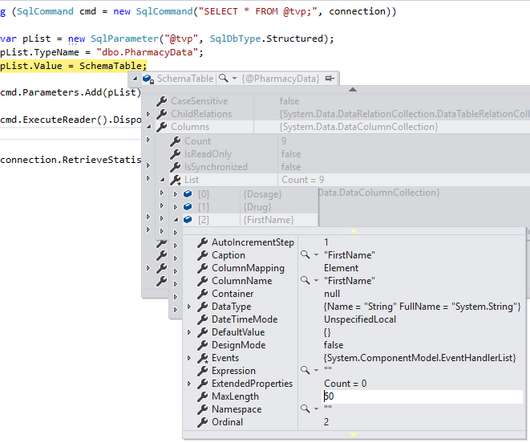
Table-valued parameters have been around since SQL Server 2008 and provide a useful mechanism for sending multiple rows of data to SQL Server, brought together as a single parameterized call. Any rows are then available in a table variable which can then be used in standard T-SQL coding, which eliminates the need to write specialized processing logic for breaking the data down again.
Dynatrace news. Automated cluster extension with feedback. Our new Cluster node REST API endpoints dedicated for cluster management assist cluster administrators in setting up automation around bootstrapping a new cluster or extending cluster size. Adding a new cluster node is a blocking operation, so no other node can join the cluster at the same time.
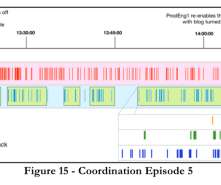
Trade-offs under pressure: heuristics and observations of teams resolving internet service outages , Allspaw, Masters thesis, Lund University 2015. This is part 2 of our look at Allspaw’s 2015 master thesis (here’s part 1 ). Today we’ll be digging into the analysis of an incident that took place at Etsy on December 4th, 2014. 1:00pm Eastern Standard Time the Personalisation / Homepage Team for Etsy are in a conference room kicking off a lunch-and-learn session on the personalis
Tasktop’s latest product release—Tasktop Integration Hub v20.1—is out today, making toolchain integration even easier and sophisticated , to help you to seamlessly scale your enterprise software delivery. Key highlights include: Simple navigation of relationships between configuration elements. New scheduler for full scans . Configuring flow of private and public comments.
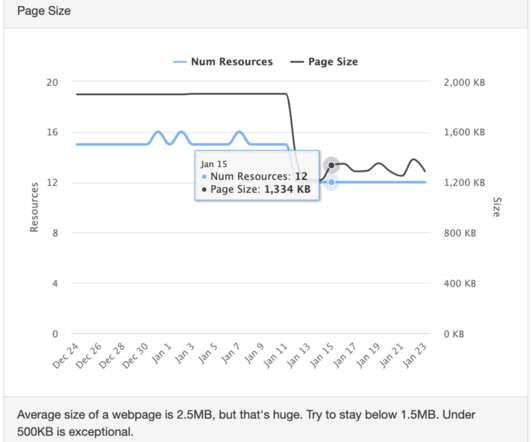
Tell me if you’ve experienced this before. You run a speed test on a website, and the results don’t match what you personally experience. Perhaps you feel like your site loads fairly quickly, but the speed test results are sub-optimal. You may even have a client who’s wondering why they’re getting inconsistent results on tests they’ve run on a site you built for them.
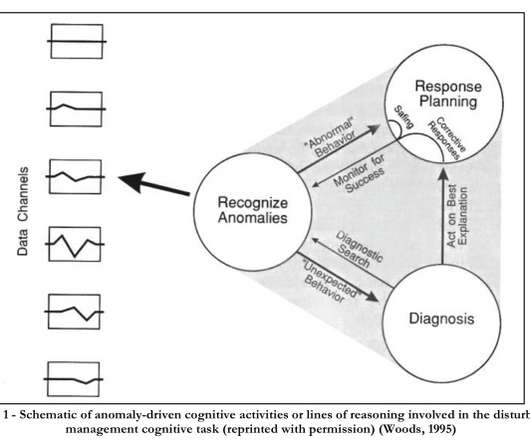
STELLA: report from the SNAFU-catchers workshop on coping with complexity , Woods 2017, Coping with Complexity workshop. “Coping with complexity” is about as good a three-word summary of the systems and software challenges facing us over the next decade as I can imagine. Today’s choice is a report from a 2017 workshop convened with that title, and recommended to me by John Allspaw – thank you John!
Meet Jordi Böhme! He’s one of our Senior Software Engineers and Team Leads who works remotely in Germany. We spoke to him about working in a different timezone and the first time he ever saw a skunk. . How do you start your day before work? Probably very different from most other Tasktopians; I’m a remote engineer from the south-west of Germany. The mothership, Tasktop HQ, is located in Vancouver, BC.
We organize all of the trending information in your field so you don't have to. Join 5,000+ users and stay up to date on the latest articles your peers are reading.
You know about us, now we want to get to know you!
Let's personalize your content
Let's get even more personalized
We recognize your account from another site in our network, please click 'Send Email' below to continue with verifying your account and setting a password.


Let's personalize your content