This site uses cookies to improve your experience. To help us insure we adhere to various privacy regulations, please select your country/region of residence. If you do not select a country, we will assume you are from the United States. Select your Cookie Settings or view our Privacy Policy and Terms of Use.
Cookie Settings
Cookies and similar technologies are used on this website for proper function of the website, for tracking performance analytics and for marketing purposes. We and some of our third-party providers may use cookie data for various purposes. Please review the cookie settings below and choose your preference.
Used for the proper function of the website
Used for monitoring website traffic and interactions
Cookie Settings
Cookies and similar technologies are used on this website for proper function of the website, for tracking performance analytics and for marketing purposes. We and some of our third-party providers may use cookie data for various purposes. Please review the cookie settings below and choose your preference.
Strictly Necessary: Used for the proper function of the website
Performance/Analytics: Used for monitoring website traffic and interactions
Logs provide answers, but monitoring is a challenge Manual tagging is error-prone Making sure your required logs are monitored is a task distributed between the data owner and the monitoring administrator. Often, it comes down to provisioning YAML configuration files and listing the files or log sources required for monitoring. This manual, error-prone approach can lead to monitoring gaps, which become critical when a host or service has an outage or incident.
Microservices-based architecture splits applications into multiple independent deployable services, where each service provides a unique functionality. Every architectural style has pros and cons. One of the challenges of micro-service architecture is complex debugging/troubleshooting. Distributed Tracing In a microservice world, distributed tracing is the key to faster troubleshooting.
PostgreSQL releases are incremental evolutions that improve the product. The beta version 17 was recently released, and there are two small items you may overlook unless you have them pointed out to you. So, “Point! Point!”MERGE()MERGE() was a new feature of PostgreSQL 15.
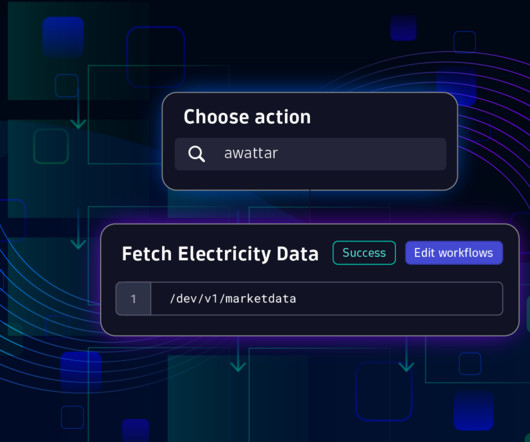
To address this challenge, the Dynatrace App Toolkit allows you to create custom workflow actions, providing seamless integration with third-party systems. This extends the capabilities of AutomationEngine for all users in your environment. Prerequisites Before you begin, please make sure you have the following: Access to a Dynatrace environment (for example [link] environment-id.apps.dynatrace.com ) where you can install and access Dynatrace® Apps and run Workflows.
An encrypted home directory is typically used to protect a user's personal data by encrypting the contents of their home directory. This directory is only decrypted and mounted when the user logs in, providing an extra layer of security.
Percona is thrilled to announce the release of ARM support in Percona Operator for MongoDB 1.16.0. This new feature addresses one of our community’s top requests and opens up exciting new possibilities for our users.What is ARM, and why is it important?ARM is an architecture for computer processors that is becoming increasingly popular.
At the annual Build conference, Microsoft announced the flex consumption plan for Azure Functions, which brings users fast and large elastic scale, instance size selection, private networking, availability zones, and higher concurrency control.
Sign up to get articles personalized to your interests!
Technology Performance Pulse brings together the best content for technology performance professionals from the widest variety of industry thought leaders.
At the annual Build conference, Microsoft announced the flex consumption plan for Azure Functions, which brings users fast and large elastic scale, instance size selection, private networking, availability zones, and higher concurrency control.
We have released Dynatrace Managed version 1.292. To learn what’s new, have a look at the release notes. The post Dynatrace Managed release notes version 1.292 appeared first on Dynatrace news.
In this article, I will discuss: The concept of Deep Work Why it is important in this day and age What are some of the unique challenges that Site Reliability Engineers face that make it hard to do Deep Work in their field? Some strategies that Site Reliability Engineering teams can employ to overcome these unique challenges and create an environment for Deep Work for SREs What Is Deep Work?
This is the second part of the series of blog posts unmasking the complexity of MongoDB cluster exposure in Kubernetes with Percona Operator for MongoDB. In the first part, we focused heavily on split horizons and a single replica set.
I’ve given my share of presentations over the years. I am under no illusions that I am anything more than a marginal presenter. My presentations are information dense, a function of how I learn. Many years ago, I realized that I learn when I’m drinking from the fire hose, not when content is spoon fed to me. I am focused and engaged with the prior; I become disinterested and disengaged with the latter.
OEMs face incredible challenges today. They’re being asked to do more with less as supply chain and operation overrun issues create a legitimate OEM crisis. And yet, more often than not, OEMs don’t consider their underlying tech stack technologies until they are way too deep into said crisis. By that point, the amount of money they need to spend to get out of the crisis almost panic-inducing—and often it’s just too late.
I'm in the process of adding more components to my OpenTelemetry demo (again!). The new design deploys several warehouse services behind the inventory service so the latter can query the former for data via their respective HTTP interface. I implemented each warehouse on top of a different technology stack. This way, I can show OpenTelemetry traces across several stacks.
In most database systems, like MySQL, PostgreSQL, and MongoDB, replication of some kind is used to create a highly available architecture. Valkey/Redis is no different in this regard. Replication is native functionality to Valkey, supporting multiple replicas, and even chains of replication.
In the dynamic world of cloud computing, agility and efficiency in deploying applications are paramount. Azure Container Instances (ACI) represents a breakthrough in cloud technology, offering a streamlined and cost-effective solution for running containers on Microsoft Azure. Designed with simplicity and scalability in mind, ACI allows developers and IT professionals to swiftly deploy containers without the complexity of managing virtual machines or higher-level services like Kubernetes.
With the complexity of modern software applications, one of the biggest challenges for developers is simply understanding how applications behave. Understanding the behavior of your app is key to maintaining its stability, performance, and security. This is a big reason why we do application logging : to capture and record events through an application’s lifecycle so that we can gain valuable insights into our application.
At a high level, bad data is data that doesn’t conform to what is expected. For example, an email address without the “ @ ”, or a credit card expiry where the MM/YY format is swapped to YY/MM. “Bad” can also include malformed and corrupted data, such that it’s completely indecipherable and effectively garbage. In any case, bad data can cause serious issues and outages for all downstream data users, such as data analysts, scientists, engineers, and ML and AI practitioners.
For most people looking for a log management and analytics solution, Elasticsearch is the go-to choice. The same applies to InfluxDB for time series data analysis. These were exactly the choices of NetEase, one of the world's highest-yielding game companies but more than that. As NetEase expands its business horizons, the logs and time series data it receives explode, and problems like surging storage costs and declining stability come.
Running and managing MongoDB clusters in Kubernetes is made easy with the Percona Operator for MongoDB. Some aspects are just easy to grasp as they are well defined in the operator custom resources and documentation, but some are often considered to be a hidden craft.
In this blog post, we are going to implement the concept of sharding in a Valkey setup. This is a built-in feature and can be implemented by enabling clustering in the Valkey configuration.Sharding, in general, helps in distributing/scaling application writes over multiple nodes. In a similar fashion, it works in Valkey.
We organize all of the trending information in your field so you don't have to. Join 5,000+ users and stay up to date on the latest articles your peers are reading.
You know about us, now we want to get to know you!
Let's personalize your content
Let's get even more personalized
We recognize your account from another site in our network, please click 'Send Email' below to continue with verifying your account and setting a password.


Let's personalize your content