This site uses cookies to improve your experience. To help us insure we adhere to various privacy regulations, please select your country/region of residence. If you do not select a country, we will assume you are from the United States. Select your Cookie Settings or view our Privacy Policy and Terms of Use.
Cookie Settings
Cookies and similar technologies are used on this website for proper function of the website, for tracking performance analytics and for marketing purposes. We and some of our third-party providers may use cookie data for various purposes. Please review the cookie settings below and choose your preference.
Used for the proper function of the website
Used for monitoring website traffic and interactions
Cookie Settings
Cookies and similar technologies are used on this website for proper function of the website, for tracking performance analytics and for marketing purposes. We and some of our third-party providers may use cookie data for various purposes. Please review the cookie settings below and choose your preference.
Strictly Necessary: Used for the proper function of the website
Performance/Analytics: Used for monitoring website traffic and interactions
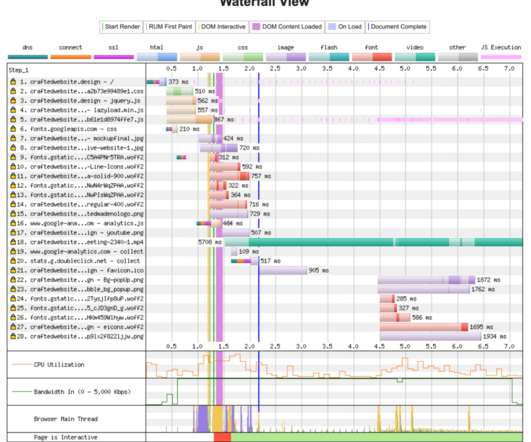
Optimizing your images is often the very first suggestion that any performance writer or consultant will make when it comes to optimizing a website. We’re no exception. Make no mistake, this is a key step to take and should absolutely be a part of your web design/development routine. However, what do you do when you optimize your images and still don’t see a noticeable improvement in the performance of your site?
Is Internet Explorer.irrelevant? A question that has been on the back of minds for many web developers and testers who are involved in cross-browser testing. “Does Browser Testing On Internet Explorer Still Make Sense?”. We are into 2020 and it has been more than 6 years since Internet Explorer last received an upgrade from Microsoft. On 1/12/2016, Microsoft ended support for IE10 and older versions.
Automation is cool. You simply choose the best tool, create test scripts for your smoke test suite and regression test suite, and click the "run" button. Then you get to sit back and watch stuff zip around the screen. The benefit: Testers get to spend time doing exploratory testing or partake in other valuable testing pursuits because their routine testing now takes minutes, right?
Dynatrace news. In part one, we began our discussion about intellectual debt by pointing out how machine learning systems contribute to the widening gap between what works and our understanding of why it works. Part two added a few simple examples of how intellectual debt might accrue, highlighting the subtle but real drag on efficiency. We concluded by suggesting that the fuzziness of machine learning systems presents a fundamental problem for autonomous IT operations.
Until recently, manual traceability from compliance reporting has held back large organizations from becoming software innovators. Now, enterprise toolchain integration is helping organizations across heavily-regulated industries, such as healthcare, automobile, finance and government, to automate the sophisticated flow of work from ideation to operation, helping them obtain one source of truth into a product’s development.
Learn more about clustering with MuleSoft. 1.0 What Is Clustering? Clustering is a group of servers or mule runtime which acts as a single unit. Mulesoft Enterprise Edition supports scalable clustering to provide high availability for the Mulesoft application. In simple terms, virtual servers composed of multiple nodes and they communicate and share information through a distributed shared memory grid.
As we enter a new decade, we asked programming experts?—including several of our own O’Reilly authors and instructors?—for their thoughts on what’s in store for some established players and fast-growing languages. Python. The biggest news this year in Python is that creator and “benevolent dictator for life” Guido van Rossum retired , leaving Python in the hands of the Python Steering Council.
Dynatrace news. Having released this functionality in an Preview Release back in September 2019, we’re now happy to announce the General Availability of our Citrix monitoring extension. This extends Dynatrace visibility into Citrix user experience and Citrix platform performance. Citrix is a sophisticated, efficient, and highly scalable application delivery platform that is itself comprised of anywhere from hundreds to thousands of servers.
Sign up to get articles personalized to your interests!
Technology Performance Pulse brings together the best content for technology performance professionals from the widest variety of industry thought leaders.
Dynatrace news. Having released this functionality in an Preview Release back in September 2019, we’re now happy to announce the General Availability of our Citrix monitoring extension. This extends Dynatrace visibility into Citrix user experience and Citrix platform performance. Citrix is a sophisticated, efficient, and highly scalable application delivery platform that is itself comprised of anywhere from hundreds to thousands of servers.
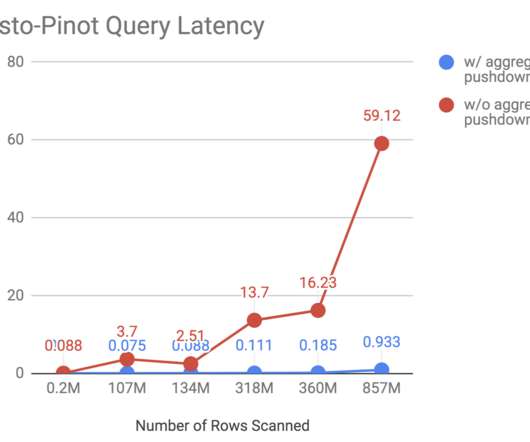
Uber leverages real-time analytics on aggregate data to improve the user experience across our products, from fighting fraudulent behavior on Uber Eats to forecasting demand on our platform. . As Uber’s operations became more complex and we offered additional features and … The post Engineering SQL Support on Apache Pinot at Uber appeared first on Uber Engineering Blog.
Make sure you stay covered! Test Coverage and Code coverage are the most popular methodologies for measuring the effectiveness of the code. Though these terms are sometimes used interchangeably since their underlying principles are the same. But they are not as similar as you may think. Many times, I have noticed the testing team and development team being confused over the use of these two terminologies.
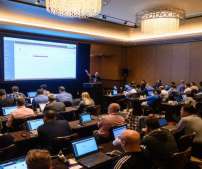
Some may see testing as a fairly boring and static set of practices, but leaders in this space know it is a vibrant discipline that is constantly improving every year, thanks to exciting new techniques made possible by better automation tools and artificial intelligence. More than ever, software quality drives business growth. Attending conferences is the best way to keep your skills and knowledge about these trends up to date and connect with your peers in the larger testing community.
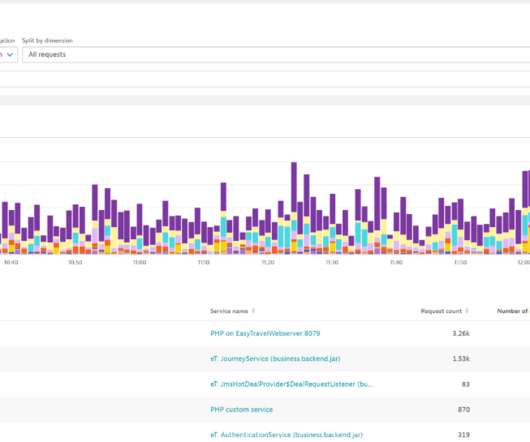
Dynatrace news. As the owner of a ride-hailing company, for example, you might have questions like “How many active drivers do we have per region?”, “What’s their average ride distance?”, or “Which are the most popular destinations?” Also, you’d probably like to be alerted of significant anomalies. In an existing application landscape, however, it can be difficult to get to those metrics.
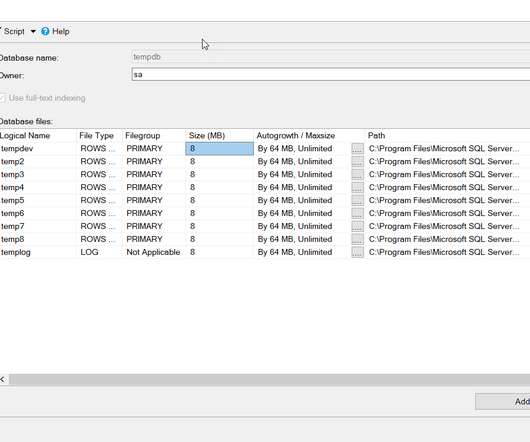
In this article, we will discuss the best practices that should be followed in order to keep the TempDB database in a healthy state and prevent any unexpected growth of the database, in addition to the procedure that can be followed to detect this unexpected growth once occurred. TempDB overview The TempDB database is one […].
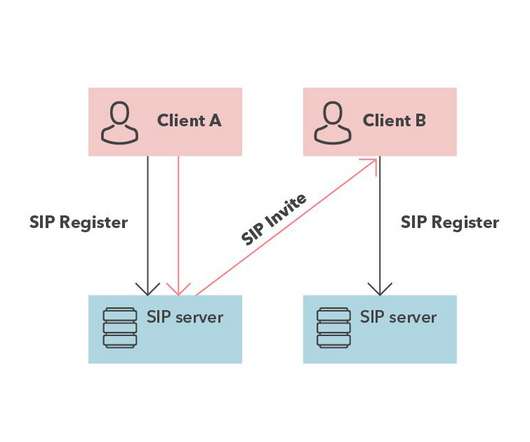
Avoid these pitfalls of scaling VoIP to cluster. VoIP technologies have a reputation for being rather complex and not without good reason. This is not to say, however, that any mid-level developer will have much difficulty finding and handling one of many available open-source servers. The only problem is the lack of information and real-world examples, as VoIP server homepages rarely have configurations that go beyond the very simplest option, and even when they do, they may be not up-to-date.
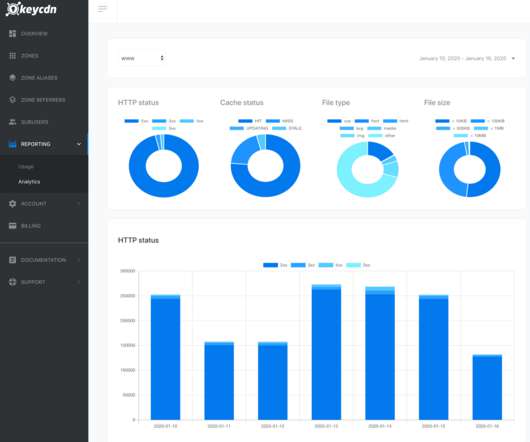
We’ve developed an all-new dashboard that comes with a new look! You’ll benefit from better usability and many small improvements. The new dashboard offers excellent performance and better workflows. This will allow you to manage your Zones more efficiently. With the new dashboard, we can ensure improved responsiveness for tablets and mobile phones.
Dynatrace news. We’re honored to start out the New Year at Dynatrace with news that we’ve been recognized with another company culture award. On Monday, January 13, Built in Boston announced the winners of its 2020 “Best Places to Work in Boston” awards. Dynatrace placed 38 th on their list. This award validates the kind of thriving and innovative work culture Dynatrace has long prided itself on.
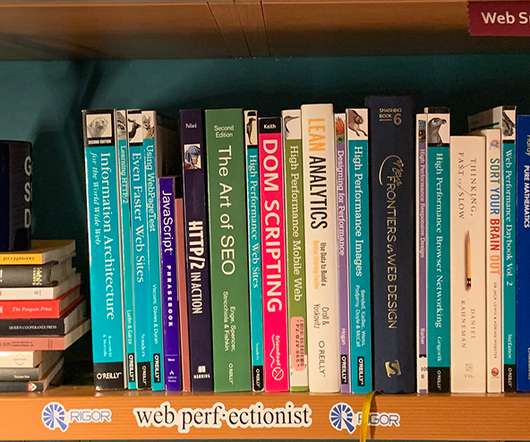
Why share the library of the web performance books while there’s a substantial collection of fantastic websites and articles on the net? When it comes to web content, you can easily find what you need through many different paths, from search engines and social media to playlists and blogs, jumping. The post Web Performance Bookshelf appeared first on Production.
Learn how to conduct effective unit tests. First of all, I will start with a disclaimer that I am a strong proponent of using the simple factory programming idiom and by extension of using the Factory Method Pattern , instead of creating objects inside classes. The factory idiom helps you to insulate your code to changes thereby adhering to the Open to Extension Close to modification principle of object-oriented programming.
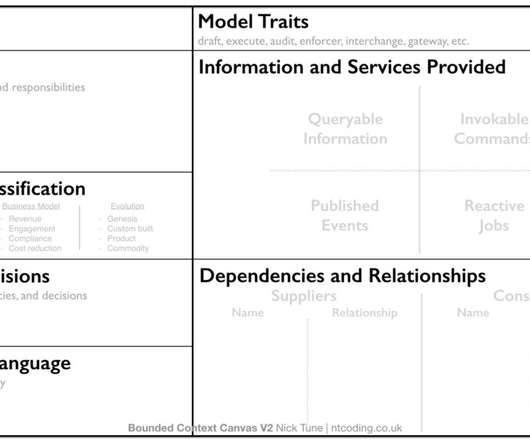
Six months ago I wrote about the Bounded Context Canvas. In the six months since I’ve received feedback from my own workshops and other people’s workshops about ways to improve the canvas. Here is V2 of the canvas. Please feel free to use it, create remixes, or simply take it as inspiration to develop your own ways of designing bounded contexts. Whatever you do, I’d love to hear about it?
Dynatrace news.Net. Added support for Azure Functions 2.x. Node.js. Added support for Node.js 13 for Linux, Alpine Linux 64-bit (PPCLE). Added support for Node.js 13 for Linux, Alpine Linux 64-bit (x86), Windows (x86). PHP. Added support for MongoDB PHP for Windows 1.3+. Added support for Memcached 3.0.0+. Added support for Redis 4.0.0+. Current support changes.
Reading time 1 min Why share the library of the web performance books while there’s a substantial collection of fantastic websites and articles on the net? When it comes to web content, you can easily find what you need through many different paths, from search engines and social media to playlists and blogs, jumping from one source to another with just a tap of a finger.
Learn more about Postman for MuleSoft Anypoint Platform APIs. Overview. Postman has pretty much become the de facto standard for any developer that works with APIs. It provides an intuitive interface that’s easy to use and allows developers an easy way to configure, interact, and test APIs. Out-of-the-box, you can use Postman to call the Anypoint Platform APIs but there are some tips and tricks in this article to help make it easier.
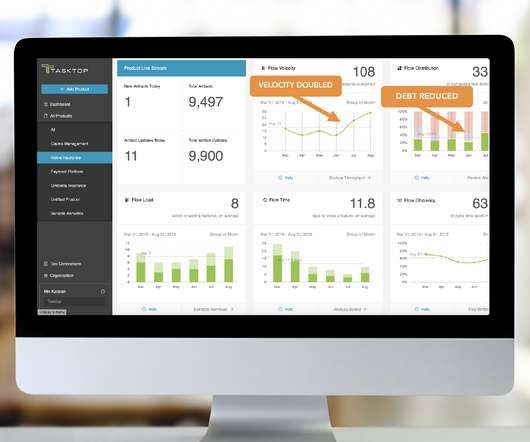
“If you measure anything, measure wait time” – Dominica DeGrandis, Making Work Visible. A major part of Flow Metrics is tracking all the work that goes into planning, building and delivering a product for the business. Just as it’s important to track how much value you’re delivering, how long work is takin, and how much WIP your teams have, it’s also vital to track what work is actively (code, test, automation, designing and all that creative work) being worked on to identify where waste a
Dynatrace news. Support changes. Synthetic-enabled ActiveGate Chromium update. Synthetic-enabled ActiveGate version 1.183 introduces support for Chromium version 78 and is backward compatible with currently used version 73. To take advantage of the new Chromium version on Linux, you need to update it using the Dynatrace-provided installation packages.
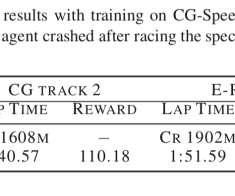
Programmatically interpretable reinforcement learning , Verma et al., ICML 2018. Being able to trust (interpret, verify) a controller learned through reinforcement learning (RL) is one of the key challenges for real-world deployments of RL that we looked at earlier this week. It’s also an essential requirement for agents in human-machine collaborations (i.e, all deployments at some level) as we saw last week.
Find out more about client-side performance! Client-Side Performance Testing Importance and Introduction. If you're worried about the performance of your web application, you need to test and analyze not only with what happens on the server but also with what happens in the browser. Some commercial performance-monitoring solutions already take this into account, allowing performance engineers to see how long it takes for elements to render, and then to execute, on your users' browsers.
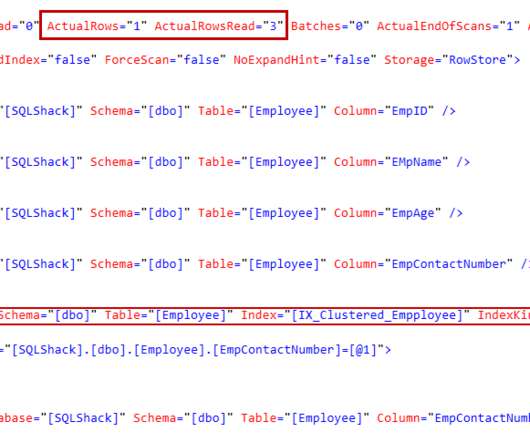
In this article, we will discuss the most important points that we should consider when designing an optimal SQL index. Before going through the index design procedure, let us revise the SQL Server index concept. SQL Server index overview SQL index is considered as one of the most important factors in the SQL Server performance […].
Why share the library of the web performance books while there’s a substantial collection of fantastic websites and articles on the net? When it comes to web content, you can easily find what you need through many different paths, from search engines and social media to playlists and blogs, jumping. The post Web Performance Bookshelf appeared first on Production.
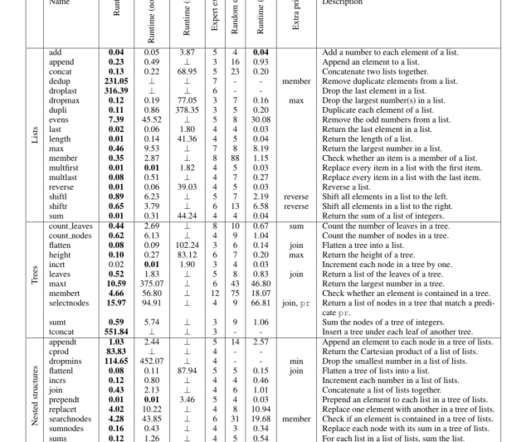
Synthesizing data structure transformations from input-output examples , Feser et al., PLDI’15. The Programmatically Interpretable Reinforcement Learning paper that we looked at last time out contained this passing comment coupled with a link to today’s paper choice: It is known from prior work that such [functional] languages offer natural advantages in program synthesis.
In my [last blog post]([link] community-blog/2019/08/01/how-to-build-a-percona-server-stack-on-a-raspberry-pi-3/) I showed you how to get the entire Percona “Stack" up and running on a Raspberry Pi. This time around, I would like to show the impact on performance between using an SSD hard disk and a standard hard disk. Disk performance is a key factor in Percona Server for MySQL (or any RDB platform) performance on a Raspberry Pi 4.
This article gives an introduction of the non-clustered index in SQL Server using examples. Introduction In a previous article Overview of SQL Server Clustered indexes, we explored the requirement of an index and clustered indexes in SQL Server. Before we proceed, let’s have a quick summary of the SQL Server clustered index: It physically sorts […].
SQL Server BDC Hints and Tips: TEMPDB Disk Usage I was troubleshooting a master-0 pod eviction due to disk pressure. The pod was shutdown Ephemeral space reclaimed (85% to 73%) – Deleted unused images from the node ( I.E. docker image purge …) The pod was started and master-0 came back online Right after the resta
Challenges of real-world reinforcement learning , Dulac-Arnold et al., ICML’19. Last week we looked at some of the challenges inherent in automation and in building systems where humans and software agents collaborate. When we start talking about agents , policies , and modelling the environment , my thoughts naturally turn to reinforcement learning (RL).
Dynatrace news. Please note that this configuration change will affect all our Dynatrace public alert notification IP addresses. Your action is required: Whitelist newly added public IP addresses. Our public IP addresses are used by Dynatrace SaaS to send out Dynatrace-detected problem notifications through your configured alerting channels (Webhook, ServiceNow, etc).
SQL Server BDC Hints and Tips: The node’s Journal can be your best friend If you are new to Kubernetes (K8’s), like I am, you quickly learn that the servicing node’s journal holds a wealth of information. In the lab I was encountering evictions due to memory, disk space and other resource limitations.
Using SQLBCP Native/Format File vs Text File and the BOM SQL Server Bulk Copy operations (BCP.exe, OpenRowset BULK, …) have specific abilities depending on the data file format specified. Native (-n) or Format (-f) Files The data file storage is binary allowing character strings to be stored as single or multi-byte strings on a per column definition.
Microsoft SQL Server I/O Basics Author: Bob Dorr, Microsoft SQL Server Escalation Published: December, 2004 SUMMARY: Learn the I/O requirements for Microsoft SQL Server database file operations. This will help you increase system performance and avoid I/O environment errors. Copyright The information contained in this document represents the current view of Microsoft Corporation on the issues discussed as of the date of publication.
Using SQL Server’s SNITrace to Troubleshoot Networking Issues In the process of tracking down a few TCP 10054 issues (highlighted here: [link] ) I also used the SNITrace (SNI Trace) capabilities. SNITrace, formally BIDTrace, is an deeper level of tracing for the Microsoft SQL Server TDS consumer
We organize all of the trending information in your field so you don't have to. Join 5,000+ users and stay up to date on the latest articles your peers are reading.
You know about us, now we want to get to know you!
Let's personalize your content
Let's get even more personalized
We recognize your account from another site in our network, please click 'Send Email' below to continue with verifying your account and setting a password.


Let's personalize your content