This site uses cookies to improve your experience. To help us insure we adhere to various privacy regulations, please select your country/region of residence. If you do not select a country, we will assume you are from the United States. Select your Cookie Settings or view our Privacy Policy and Terms of Use.
Cookie Settings
Cookies and similar technologies are used on this website for proper function of the website, for tracking performance analytics and for marketing purposes. We and some of our third-party providers may use cookie data for various purposes. Please review the cookie settings below and choose your preference.
Used for the proper function of the website
Used for monitoring website traffic and interactions
Cookie Settings
Cookies and similar technologies are used on this website for proper function of the website, for tracking performance analytics and for marketing purposes. We and some of our third-party providers may use cookie data for various purposes. Please review the cookie settings below and choose your preference.
Strictly Necessary: Used for the proper function of the website
Performance/Analytics: Used for monitoring website traffic and interactions
GigaOm recently released its 2024 Radar Report for Cloud Observability, which includes 21 observability solution providers and analyzes each on their current and emerging features. The report offers a better understanding of the observability landscape. The analysis centers on the following key focus areas: Dashboards and reporting User interaction performance monitoring Multicloud functionality Large language model (LLM) support Pushing and tagging data Predictive analysis Edge observability Id
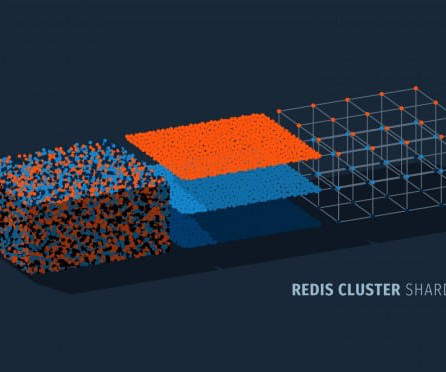
Grasping the concept of Redis sharding is essential for expanding your Redis database. This method involves splitting data over various nodes to improve the database’s efficiency. In this article, we will explain Redis sharding, explore its pros and cons, and how to apply it. Key Takeaways Redis sharding is a method of splitting the keyspace into 16384 hash slots for distribution across nodes.
This blog post is for both novice and seasoned audiences alike. If you’re interested in the relevance and utility of SLOs and how they might be helpful for you, you’ve come to the right place. The first part of this blog post briefly explores the integration of SLO events with AI. The second part delves into the approach to be adopted with SLOs based on a client’s context and environment, considering whether SLAs (Service Level Agreements) have already been historically defined.
With all the convenience Kubernetes operators provide in managing resources, it can still be a challenge to conveniently store, query, manage, and download the database logs from the pods.
In the fast-paced world of technology, leadership roles present both opportunities to innovate and unique challenges, particularly for women. For me, working in tech has brought flexibility and continuous learning. As a mother of two children, this flexibility helps me manage my home and team in tandem. Meanwhile, the rapidly evolving technical landscape encourages me to learn new skills and forces me to stay on my toes.
We explain what Interaction to Next Paint (INP) is, how it impacts performance, and why GTmetrix doesn’t track it (yet). Overview Interaction to Next Paint (INP) is Google’s new “responsiveness” field metric that was first announced as an experimental metric in 2022.
PostgreSQL’s reputation as a powerful, open source database management system has been steadily rising, making it a top choice for businesses looking to upgrade or switch their database infrastructure. Thanks to its comprehensive SQL compliance, scalability, performance, and cost efficiency, it stands out as a preferred option among developers and database administrators.
We explain the key differences between field and lab data and how you should interpret them. Overview Web performance metrics can be broadly classified into two distinct groups – field data and lab (synthetic data). Each dataset has a different source (i.e., where the data comes from), and is gathered using different methodologies.
We explain the key differences between field and lab data and how you should interpret them. Overview Web performance metrics can be broadly classified into two distinct groups – field data and lab (synthetic data). Each dataset has a different source (i.e., where the data comes from), and is gathered using different methodologies.
We organize all of the trending information in your field so you don't have to. Join 5,000+ users and stay up to date on the latest articles your peers are reading.
You know about us, now we want to get to know you!
Let's personalize your content
Let's get even more personalized
We recognize your account from another site in our network, please click 'Send Email' below to continue with verifying your account and setting a password.


Let's personalize your content