This site uses cookies to improve your experience. To help us insure we adhere to various privacy regulations, please select your country/region of residence. If you do not select a country, we will assume you are from the United States. Select your Cookie Settings or view our Privacy Policy and Terms of Use.
Cookie Settings
Cookies and similar technologies are used on this website for proper function of the website, for tracking performance analytics and for marketing purposes. We and some of our third-party providers may use cookie data for various purposes. Please review the cookie settings below and choose your preference.
Used for the proper function of the website
Used for monitoring website traffic and interactions
Cookie Settings
Cookies and similar technologies are used on this website for proper function of the website, for tracking performance analytics and for marketing purposes. We and some of our third-party providers may use cookie data for various purposes. Please review the cookie settings below and choose your preference.
Strictly Necessary: Used for the proper function of the website
Performance/Analytics: Used for monitoring website traffic and interactions
Expectations for network monitoring In today’s digital landscape, businesses rely heavily on their IT infrastructure to deliver seamless services to customers. However, network issues can lead to significant downtime, affecting user experience and business operations. For more details, please refer to Dynatrace Documentation.
In this post I want to look at how CSS can prove to be a substantial bottleneck on the network (both in itself and for other resources) and how we can mitigate it, thus shortening the Critical Path and reducing our time to Start Render. and is constantly stopping and starting as different part of the document block it.
Why browser and HTTP monitors might not be sufficient In modern IT environments, which are complex and dynamically changing, you often need deeper insights into the Transport or Network layers. Is it a bug in the codebase, a malfunctioning backend service, an overloaded hosting infrastructure, or perhaps a misconfigured network?
We are updating product documentation to include underlying static assumptions. Network traffic power calculations rely on static power estimations for both public and private networks. Static assumptions are: Local network traffic uses 0.12 Public network traffic uses 1.0
The new Dynatrace capability integrates seamlessly into existing Java applications, providing continuous monitoring, detection, and protectionwithout requiring custom rules, code modifications, or additional network filtering. Visit Dynatrace Documentation for details. group of companies.
Metric definitions are often scattered across various databases, documentation sites, and code repositories, making it difficult for analysts and data scientists to find reliable information quickly. Our ecosystem enables engineering teams to run applications and services at scale, utilizing a mix of open-source and proprietary solutions.
Host Monitoring dashboards offer real-time visibility into the health and performance of servers and network infrastructure, enabling proactive issue detection and resolution. This information is crucial for identifying network issues, troubleshooting connectivity problems, and ensuring reliable domain name resolution.
These include traditional on-premises network devices and servers for infrastructure applications like databases, websites, or email. A local endpoint in a protected network or DMZ is required to capture these messages. Read syslog ingestion documentation with configuration samples. See installation documentation for setup.
Dynatrace VMware and virtualization documentation . Dynatrace Kubernetes documentation . Dynatrace OneAgent documentation . Dynatrace root cause analysis documentation . When using autoscaling-mechanisms and having a lot of application containers, tracing requests through the network is a challenging task.
It’s also critical to have a strategy in place to address these outages, including both documented remediation processes and an observability platform to help you proactively identify and resolve issues to minimize customer and business impact. Let’s explore each of these elements and what organizations can do to avoid them.
Access to source code repositories is limited on both the network and the user level. Source code management systems are only accessible from within the Dynatrace corporate network. Remote access to the Dynatrace corporate network requires multi-factor authentication (MFA). The diagram below provides an overview.
If you sniff the traffic, you don't get any network data. You can host standalone apps on a webpage or embed them in R Markdown documents or build dashboards. Data is ubiquitous. Shiny from R Studio helps to build interactive web applications from R. But, performance testing is a little tricky. What Is Shiny?
Binary Javascript Object Notation (BSON) is a binary-encoded serialization of JSON documents. MongoDB stores data in BSON format both internally and over the network. To read the content of a BSON document, you have to convert it to a human-readable format like JSON. Set the database (e.g.,
Like the driver documentation says, this is not recommended as it makes the connection susceptible to man-in-the-middle attacks. 1305:12 @(shell):1:1 2019-04-18T19:44:42.261+0530 I NETWORK [thread1] trying reconnect to SG-example-1.servers.mongodirector.com:27017 Testing Failover Behavior. 185:1 rs.stepDown@src/mongo/shell/utils.js:1305:12
Take the example of Amazon Virtual Private Cloud (VPC) flow logs, which provide insights into the IP traffic of your network interfaces. Follow the instructions available in Dynatrace documentation to allow proper access and configure Firehose settings. See CloudFormation template documentation for details.
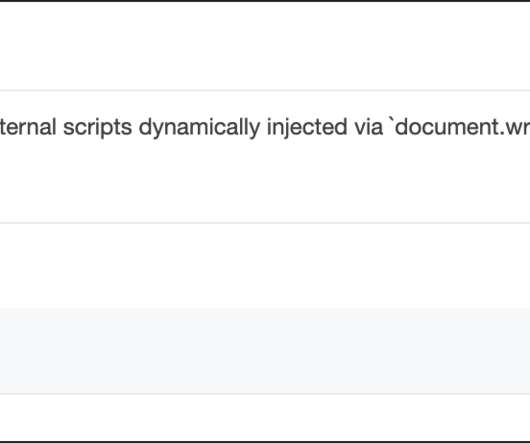
Because the Preload Scanner deals with tokeniseable src and href attributes, anything buried in JavaScript is invisible to it: document. Async snippets such as the one below suffer the same fate: var script = document. src = ' file.js ' ; document. var script = document. src = ' file.js ' ; document. write ( ' ' ).
The F5 BIG-IP Local Traffic Manager (LTM) is an application delivery controller (ADC) that ensures the availability, security, and optimal performance of network traffic flows. To access an entity’s details, you can drill down from one of the charts that highlight network metrics, availability KPIs, and the default pool.
Generating the HTML document quickly plays a big part in minimizing TTFB delays. That means TTFB includes: Cross-origin redirects, Time spent connecting to the server, Same-origin redirects, and The actual request for the HTML document. These services provide a network of globally distributed server locations.
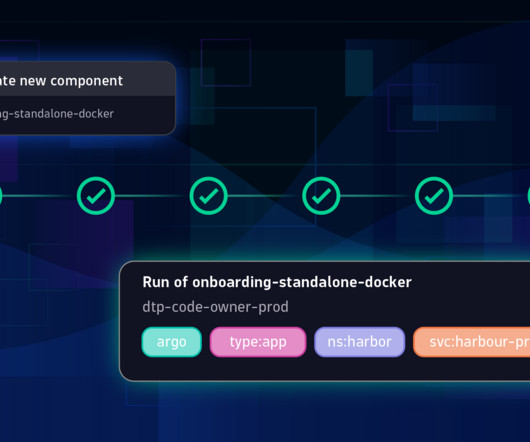
With these changes we eliminated the need for complex networking setups and Jenkins restarts. Most importantly we reduced the number of needed pull requests down to just one.
The latest batch of services cover databases, networks, machine learning and computing. Top use cases include recommendation engines, fraud detection, knowledge graphs, drug discovery, and network security. Dynatrace analyzes Amazon Neptune performance of resources (CPU, memory, network), requests and errors.
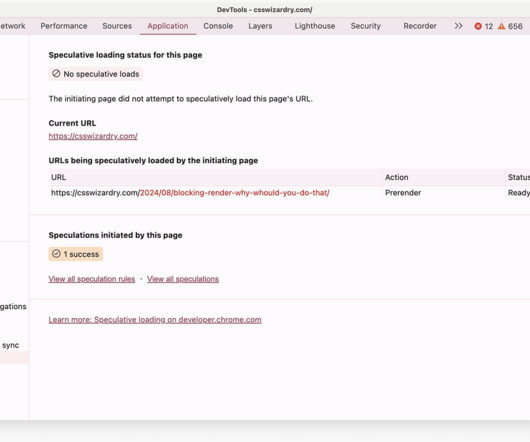
The possible navigation types are: Navigate: A hard navigation that resulted in an HTML page being fetched from the network. Navigate 70% of page views are Navigations , which means a user landed on them via a hard navigation and the file was fetched from the network. Cache: An HTML response returned from the HTTP cache.
Sample configurations and documentation. Dynatrace Documentation includes example configurations for the key use cases, as well as for non-Dynatrace customers. Users can run the Dynatrace OTel Collector to mask sensitive data next to applications and ensure that no sensitive data leaves the internal network.
Getting insights into the health and disruptions of your networking or infrastructure is fundamental to enterprise observability. For example, a supported syslog component must support the masking of sensitive data at capture to avoid transmitting personally identifiable information or other confidential data over the network.
Here’s a simple rough sketch of RAG: Start with a collection of documents about a domain. Split each document into chunks. One more embellishment is to use a graph neural network (GNN) trained on the documents. Chunk your documents from unstructured data sources, as usual in GraphRAG. at Facebook—both from 2020.
EdgeConnect acts as a bridge between Dynatrace and the network where it’s deployed Figure 1: Visualization of an EdgeConnect connection to the Dynatrace platform. Have a look at our documentation to learn more about how to configure and deploy EdgeConnect. Setting up an EdgeConnect configuration is simple.
While this example uses the metric dt.host.disk.free , you can choose any kind of capacity metric, such as host CPU, memory, or network load—you can even extract a metric value from a given log line. Tip: Download the TypeScript template from our documentation. In this example, two parallel actions are defined.
Compressing them over the network: Which compression algorithm, if any, will we use? Connection One thing we haven’t looked at is the impact of network speeds on these outcomes. Everything we’ve looked at so far has concerned itself with network performance. The former makes for a simpler build step, but is it faster? ?️
This operational data could be gathered from live running infrastructures using software agents, hypervisors, or network logs, for example. Additionally, ITOA gathers and processes information from applications, services, networks, operating systems, and cloud infrastructure hardware logs in real time. Establish data governance.
eBPF use cases range from observability, networking, security, tracing, and profiling. You'll see the term BPF in Linux source code, and you'll see BPF and eBPF used interchangeably in tooling and documentation. TLDR eBPF is a mechanism that makes the kernel dynamically programmable without modifying the source code.
As such, it’s quite often a network-shared mount point that multiple hosts use to store third party software and libraries. Dynatrace documentation lists several additional parameters that the installation process accepts (the link points to Linux customization, but other OSs are supported in a similar way).
This approach offers potentially improved performance and reliability, as the registry can be optimized for specific network environments. For current Dynatrace customers, getting started with our new signed, immutable images is easy—just refer to Dynatrace Documentation.
What I got back were two artifacts, one of them being the following video of Akamai web performance expert Robin Marx speaking at We Love Speed in France a few weeks ago: The other artifact is a Google document originally published by Patrick Meenan in 2015 but updated somewhat recently in November 2023. Lets touch on that now.
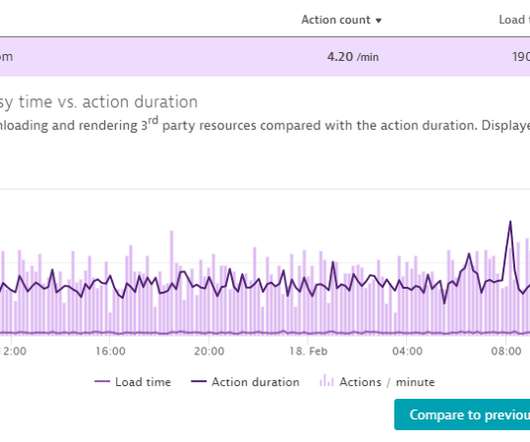
I can reload the exact same page under the exact same network conditions over and over, and I can guarantee I will not get the exact same, say, DOMContentLoaded each time. What if another file on the critical path had dropped out of cache and needed fetching from the network? There are myriad reasons for this that I won’t cover here.
When you save your changes, the connection to the remote environment is verified; if a connection can’t be established (for example, because there’s no connection at a network level), a message will be displayed accordingly. Important : In Dynatrace Managed environments, you need to configure an additional Network scope setting.
This is accomplished by implementing Citrix recommended practices and metrics, which are well-documented. Expand Citrix monitoring to include NetScaler or F5 BigIP Activate NetScaler or BigIP extensions that fit your environment and benefit from complete visibility into the application delivery chain, including the network tier.
They collect data from multiple sources through real user monitoring , synthetic monitoring, network monitoring, and application performance monitoring systems. This includes monitoring components such as web servers, databases, application performance interfaces (APIs), content delivery networks, and third-party integrations.
The Network and Information Systems 2 (NIS2) Directive, which goes into effect in Oct 2024, aims to enhance the security of network and information systems throughout the EU. NIS2 is an evolution of the Network and Information Systems (NIS) Security Directive, which has been in effect since 2016.
Migrating to cloud-based operations from a traditional on-premises networked system also requires artificial intelligence and end-to-end observability of the full software stack. The ECMA Software Modernization Working Group is standardizing application performance through monitoring.
While I could and will (in the summary section of this blog) point you to tutorials and documentation on how Dynatrace can be leveraged for API Monitoring, let me first tell you a story that was shared with me by Roman who leverages Dynatrace with one of our customers in the financial sector.
OneAgent provides end-to-end visibility, capturing real-time performance data and detailed metrics on CPU, memory, disk, network, and processes. For complete details about Dynatrace OneAgent, go to Dynatrace Documentation.
The vulnerability was first reported to the Apache Foundation (an open-source project) on November 24 by security researcher Chen Zhaojun of Alibaba, China’s largest e-commerce company, after an attack was documented on December 9 and affected servers of the game Minecraft.
Dynatrace VMware and virtualization documentation . Dynatrace Kubernetes documentation . Dynatrace OneAgent documentation . Dynatrace root cause analysis documentation . When using autoscaling-mechanisms and having a lot of application containers, tracing requests through the network is a challenging task.
How does a decision of this scale affect the efficiency of our globally distributed content delivery network, Open Connect ? The values in the Netflix culture document allow for a framework where everyone is a leader to work well?—?this Is the benefit uniform, or do certain cohorts of members?—?such benefit more?
Among the features supported by the provided scripts, you gain the ability to: Deploy OneAgent instances with either default or custom settings—tags, properties, monitoring mode, network zones, host groups, environments, hosts and more can all be custom configured, just as with standard non-scripted deployment. Participate in the Preview.
We organize all of the trending information in your field so you don't have to. Join 5,000+ users and stay up to date on the latest articles your peers are reading.
You know about us, now we want to get to know you!
Let's personalize your content
Let's get even more personalized
We recognize your account from another site in our network, please click 'Send Email' below to continue with verifying your account and setting a password.


Let's personalize your content