This site uses cookies to improve your experience. To help us insure we adhere to various privacy regulations, please select your country/region of residence. If you do not select a country, we will assume you are from the United States. Select your Cookie Settings or view our Privacy Policy and Terms of Use.
Cookie Settings
Cookies and similar technologies are used on this website for proper function of the website, for tracking performance analytics and for marketing purposes. We and some of our third-party providers may use cookie data for various purposes. Please review the cookie settings below and choose your preference.
Used for the proper function of the website
Used for monitoring website traffic and interactions
Cookie Settings
Cookies and similar technologies are used on this website for proper function of the website, for tracking performance analytics and for marketing purposes. We and some of our third-party providers may use cookie data for various purposes. Please review the cookie settings below and choose your preference.
Strictly Necessary: Used for the proper function of the website
Performance/Analytics: Used for monitoring website traffic and interactions
With the world’s increased reliance on digital services and the organizational pressure on IT teams to innovate faster, the need for DevOps monitoring tools has grown exponentially. But when and how does DevOps monitoring fit into the process? And how do DevOps monitoring tools help teams achieve DevOps efficiency?
As cloud-native, distributed architectures proliferate, the need for DevOps technologies and DevOps platform engineers has increased as well. DevOps engineer tools can help ease the pressure as environment complexity grows. ” What does a DevOps platform engineer do? ” What does a DevOps platform engineer do?
My first encounter with this monitoring system was in 2014 when I joined a project where Zabbix was already in use for monitoring network devices (routers, switches). Back then, it was version 2.2, and it had a somewhat challenging web interface, even for that time.
This transition to public, private, and hybrid cloud is driving organizations to automate and virtualize IT operations to lower costs and optimize cloud processes and systems. Besides the traditional system hardware, storage, routers, and software, ITOps also includes virtual components of the network and cloud infrastructure.
Cloud environments are vast and constantly evolving, making manual identification of misconfigurations virtually impossible. The segmentation between SecOps, who identifies misconfigurations, and DevOps, who implements the remediations, can further delay this process and lead to longer risk exposure.
Without the ability to see the logs that are relevant to your service, infrastructure, or cloud function—at exactly the right time and in exactly the right format—your cloud or DevOps engineers lose the ability to find the root causes of the issues they troubleshoot. In some deployment scenarios, you might skip CloudWatch altogether.
Examples of such weaknesses are errors in application code, misconfigured network devices, and overly permissive access controls in a database. Network analysis looks for weaknesses within a network’s configurations and policies that would allow network access to unauthorized users. Identify vulnerabilities.
Accordingly, these platforms provide a unified, consistent DevOps and IT experience. Amazon Web Services (AWS) Outpost : This offering provides pre-configured hardware and software for customers to run native AWS computing, networking, and services on-premises in a cloud-native manner. Support virtual machines and containers.
Automate DevOps pipelines to create better software faster to free up critical DevOps and IT time for new initiatives and innovation. Consider how AI-enabled chatbots such as ChatGPT and Google Bard help DevOps teams write code snippets or resolve problems in custom code without time-consuming human intervention.
Serving as agreed-upon targets to meet service-level agreements (SLAs), SLOs can help organizations avoid downtime, improve software quality, and promote automation in the DevOps lifecycle. In this post, I’ll lay out five foundational service level objective examples that every DevOps and SRE team should consider.
Unfortunately, container security is much more difficult to achieve than security for more traditional compute platforms, such as virtual machines or bare metal hosts. To function effectively, containers need to be able to communicate with each other and with network services. Network scanners. Let’s look at each type.
In addition to providing visibility for core Azure services like virtual machines, load balancers, databases, and application services, we’re happy to announce support for the following 10 new Azure services, with many more to come soon: Virtual Machines (classic ones). Azure VirtualNetwork Gateways. Azure Batch.
ScaleGrid’s Redis hosting service allows these organizations to automate all of their time-consuming management tasks, such as backups, upgrades, scaling, replication, sharding, monitoring, alerts, log rotations, and OS patching, so their DBAs, developers, and DevOps teams can focus on new product development and optimizing performance.
In particular, achieving observability across all containers controlled by Kubernetes can be laborious for even the most experienced DevOps teams. It automates complex tasks during the container’s life cycle, such as provisioning, deployment, networking, scaling, load balancing, and more. But what is Kubernetes exactly?
Getting precise root cause analysis when dealing with several layers of virtualization in a containerized world. Using a data-driven approach to size Azure resources, Dynatrace OneAgent captures host metrics out-of-the-box to assess CPU, memory, and network utilization on a VM host. Too much data requested from a database.
Dynatrace provides AWS Lambda metrics monitoring in less than five minutes, showing the function CPU, memory, and network health metrics all the way through to the process level. Automatic observability and root-cause analysis for DevOps, cloud, and apps teams. Auto-detection starts monitoring new virtual machines as they are deployed.
Weaving DevOps and the related disciplines of DevSecOps and AIOps tightly into the development process can also accelerate the process. Virtualization has revolutionized system administration by making it possible for software to manage systems, storage, and networks.
Native support for Syslog messages Syslog messages are generated by default in Linux and Unix operating systems, security devices, network devices, and applications such as web servers and databases. Native support for syslog messages extends our infrastructure log support to all Linux/Unix systems and network devices.
Dynatrace provides AWS Lambda metrics monitoring in under five minutes, showing the function CPU, memory, and network health metrics all the way through to the process level. Auto-detection starts monitoring new virtual machines as they are deployed. How does Dynatrace help?
IAST only works with languages that have a virtual runtime environment, such as Java, C#, Python, and Node.js. These include vulnerability scanners and network detection and response systems designed to detect attacks. Once an application moves into the production environment, teams usually use other tools to monitor the applications.
Have you ever had to provision 2,500 virtual host instances and 120 Kubernetes clusters in two days? True DevOps culture in action! Real-time charting for registrations, AWS infrastructure utilization, and network availability fed by AWS CloudWatch metrics. Dynatrace news. You know it’s a good idea when you get a few dinosaurs.
Cloud Native DevOps with Kubernetes : . DevOps and Continuous delivery: R evolution in the process, the way people and organizations delivering software work . Container runtime engines (such as Docker), leverage OS-level virtualization capabilities offered from the kernel to create those isolated spaces.
Serving as agreed-upon targets to meet service-level agreements (SLAs), SLOs can help organizations avoid downtime, improve software quality, and promote automation in the DevOps lifecycle. In this post, I’ll lay out five SLO examples that every DevOps and SRE team should consider.
In addition to obvious close integration with other Continuous Integration (CI) / DevOps tools, it means better ways to create/maintain load and better ways to analyze information. Data preparation and service virtualization functionality/tools would be here very handy here.
The European leg of the DevOps Enterprise (Virtual) Summit 2021 returned last week (17-20 May) as the community reflected on a year like none other. There was plenty of positivity in the (virtual) air as speakers and attendees shared stories of heart, ingenuity, courage and resilience. I want to dig into this further.
A modern APM platform that’s expressly designed with cloud-native environments in mind can deliver coverage across the full stack, encompassing the entire hybrid multicloud network. The ideal solution is an APM platform that is open and can accept data from virtually any APM tool.
We’re currently in a technological era where we have a large variety of computing endpoints at our disposal like containers, Platform as a Service (PaaS), serverless, virtual machines, APIs, etc. This infrastructure can be integrated into a DevOps pipeline to dynamically build and destroy environments as the pipeline executes.
I wear many hats in my job and while I officially call myself a “ DevOps Activist “, my official title at Dynatrace is Director of Strategic Partners. Lift & Shift is where you basically just move physical or virtual hosts to the cloud – essentially you just run your host on somebody else’s hardware. Dynatrace news.
Oh, and it just so happens that one of our favourite events of the year takes place too, providing the perfect opportunity for the DevOps community to come together: The virtualDevOps Enterprise Summit, Europe (18-20 May 2021). . OKRs & DevOps: From Micromanagement Misery to Finding Flow. Tasktop at DOES Europe 2021.
Without it, sending an email over a long distance would require the immediate availability of every node on the routing network to forward each message. This enables email message processing in a quick and reliable way, even during periods of heavy network congestion. Message queue software options to consider.
Without it, sending an email over a long distance would require the immediate availability of every node on the routing network to forward each message. This enables email message processing in a quick and reliable way, even during periods of heavy network congestion. Message queue software options to consider.
I’m pleased to announce that Containers, Virtual Machines, and Orchestration has been published to all of the popular podcast networks. The post TPDP Episode #33: Containers, Virtual Machines, and Orchestration, Part 1 appeared first on The Polyglot Developer.
ScaleGrid’s Redis hosting service allows these organizations to automate all of their time-consuming management tasks, such as backups, upgrades, scaling, replication, sharding, monitoring, alerts, log rotations, and OS patching, so their DBAs, developers, and DevOps teams can focus on new product development and optimizing performance.
Cloud Native DevOps with Kubernetes : . DevOps and Continuous delivery: R evolution in the process, the way people and organizations delivering software work . Container runtime engines (such as Docker), leverage OS-level virtualization capabilities offered from the kernel to create those isolated spaces.
Different monitoring tools were used; one for the server landscape, network layer, databases, dashboarding and Dynatrace’s AppMon for APM and User Experience Monitoring (UEM) needs. As this platform was still based on traditional Virtual Machines, I had to create my own “Dynatrace Managed Autonomous Operator”.
network engineer, at >2%) and management positions (IT manager, at close to 3%; operations manager at >1%). It encompasses private clouds, the IaaS cloud—also host to virtual private clouds (VPC)—and the PaaS and SaaS clouds. Clearly, the DevOps practices that took root over the last decade aren’t going anywhere.
ScaleGrid’s hosting for Redis™ service allows these organizations to automate all of their time-consuming management tasks, such as backups, upgrades, scaling, replication, sharding, monitoring, alerts, log rotations, and OS patching, so their DBAs, developers, and DevOps teams can focus on new product development and optimizing performance.
Each virtual machine on their VMWare private cloud follows a specific naming scheme that reflects the DR-SRM Priority Level (1-21). When disaster strikes, it is important to react fast and get live updates on the recovery progress of the business and mission-critical systems.
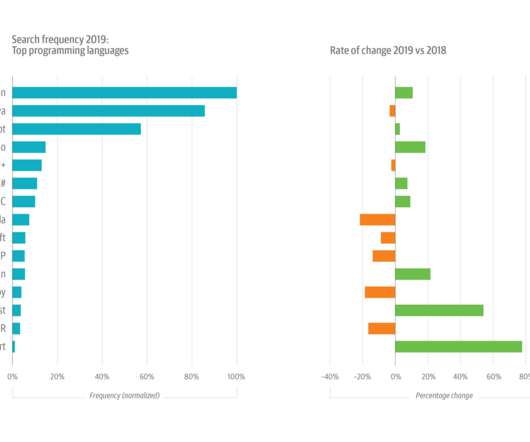
Also: infrastructure and operations is trending up, while DevOps is trending down. there’s a Python library for virtually anything a developer or data scientist might need to do. Surging interest in infrastructure and ops also explains declining usage in the configuration management (CM) and DevOps topic areas. Coincidence?
However, with today’s highly connected digital world, monitoring use cases expand to the services, processes, hosts, logs, networks, and of course, end-users that access these applications — including a company’s customers and employees. Mobile apps, websites, and business applications are typical use cases for monitoring.
It’s been just over a week since this year’s virtualDevOps Enterprise Summit USA and I don’t know about you, but I am already missing the vibrant Slack conversations, the impromptu Gather interactions, the industry-leading content and the many networking opportunities that brought together the thriving DevOps community. .
As an outcome of the DevOps Enterprise Forum I collaborated on a paper called Building Industrial DevOps Stickiness by adding an introduction to Wardley Mapping to the story. For example AWS launched an instance type with 800 Gbits/s of network bandwith in 2021. primarily virtual?—?and
When delving into the networking aspect of a hybrid cloud deployment, complexities arise due to the requirement of linking or expanding existing on-premises network architectures into the cloud sphere. Within the hybrid framework, this involves determining optimal locations for various categories of applications and data.
Marmot is a workflow execution engine from Google for processing workflows targeting DevOps/SRE needs. Sysdig instruments your physical and virtual machines at the OS level by installing into the Linux kernel and capturing system calls and other OS events. Sysdig also makes it possible to create trace files for system activity.
We organize all of the trending information in your field so you don't have to. Join 5,000+ users and stay up to date on the latest articles your peers are reading.
You know about us, now we want to get to know you!
Let's personalize your content
Let's get even more personalized
We recognize your account from another site in our network, please click 'Send Email' below to continue with verifying your account and setting a password.


Let's personalize your content