This site uses cookies to improve your experience. To help us insure we adhere to various privacy regulations, please select your country/region of residence. If you do not select a country, we will assume you are from the United States. Select your Cookie Settings or view our Privacy Policy and Terms of Use.
Cookie Settings
Cookies and similar technologies are used on this website for proper function of the website, for tracking performance analytics and for marketing purposes. We and some of our third-party providers may use cookie data for various purposes. Please review the cookie settings below and choose your preference.
Used for the proper function of the website
Used for monitoring website traffic and interactions
Cookie Settings
Cookies and similar technologies are used on this website for proper function of the website, for tracking performance analytics and for marketing purposes. We and some of our third-party providers may use cookie data for various purposes. Please review the cookie settings below and choose your preference.
Strictly Necessary: Used for the proper function of the website
Performance/Analytics: Used for monitoring website traffic and interactions
When it comes to site reliability engineering (SRE) initiatives adopting DevOps practices, developers and operations teams frequently find themselves at odds with one another. Keptn is an opensource control plane that enables cloud-native continuous delivery and automated operations. Too many SLOs create complexity for DevOps.
These are just a few of the open-source technologies you may encounter as you research observability solutions for managing complex multicloud IT environments and the services that run on them. Of these open-source observability tools, one stands out. Logs, metrics, and traces make up the bulk of all telemetry data.
“This is a mouthful of buzzwords” is how I started my recent presentations at the Online Kubernetes Meetup as well as the DevOps Fusion 2020 Online Conference when explaining the three big challenges we are trying to solve with Keptn – our CNCF OpenSource project: Automate build validation through SLI/SLO-based Quality Gates.
As a solution, teams often adopt opensource observability tools like OpenTelemetry to gain situational awareness of their cloud-native environments. Opensource observability tools help address cloud complexity. Using open-source tools to tame cloud complexity can lead to data silos.
As a result, IT operations, DevOps , and SRE teams are all looking for greater observability into these increasingly diverse and complex computing environments. In IT and cloud computing, observability is the ability to measure a system’s current state based on the data it generates, such as logs, metrics, and traces.
The growing popularity of opensource software presents new risks associated with vulnerable libraries. To handle the increasing complexity of opensource software, software composition analysis (SCA) has become an important tool. As part of the process, SCA provides a full analysis of opensource project health metrics.
We added monitoring and analytics for log streams from Kubernetes and multicloud platforms like AWS, GCP, and Azure, as well as the most widely used open-source log data frameworks. Whatever your use case, when log data reflects changes in your infrastructure or business metrics, you need to extract the metrics and monitor them.
The time and effort saved with testing and deployment are a game-changer for DevOps. This opens the door to auto-scalable applications, which effortlessly matches the demands of rapidly growing and varying user traffic. In production, containers are easy to replicate. Here the overlap with Kubernetes begins. What is Kubernetes?
Endpoints include on-premises servers, Kubernetes infrastructure, cloud-hosted infrastructure and services, and open-source technologies. A full-stack observability solution uses telemetry data such as logs, metrics, and traces to give IT teams insight into application, infrastructure, and UX performance. Watch webinar now!
In enterprises, SREs, DevOps, and cloud architects often discuss which platform to choose for observability for faster troubleshooting of issues and understanding about performance of their production systems. Will the tool support all kinds of data aggregation, such as logs, metrics, traces, topology, etc.?
To accomplish this, organizations have widely adopted DevOps , which encompasses significant changes to team culture, operations, and the tools used throughout the continuous development lifecycle. Configurations can be managed centrally as a single source of truth for easier revision, including versioning support.
Opensource code, for example, has generated new threat vectors for attackers to exploit. A case in point is Log4Shell, which emerged in late 2021 and exposed opensource libraries to exploitation. Dynatrace introduces automatic vulnerability management for PHP opensource scripting language – blog.
Centralization of platform capabilities improves efficiency of managing complex, multi-cluster infrastructure environments According to research findings from the 2023 State of DevOps Report , “36% of organizations believe that their team would perform better if it was more centralized.” Ensure that you get the most out of your product.
After a decade of helping companies manage container orchestration, Kubernetes, the opensource container platform, has established itself as a mature enterprise technology. He points to the shift from DevOps to platform engineering , or as he calls it, Foundation Engineering. “And these layers tend to be similar.
As organizations look to expand DevOps maturity, improve operational efficiency, and increase developer velocity, they are embracing platform engineering as a key driver. The pair showed how to track factors including developer velocity, platform adoption, DevOps research and assessment metrics, security, and operational costs.
In this article, we’ll explore these challenges in detail and introduce Keptn, an opensource project that addresses these issues, enhancing Kubernetes observability for smoother and more efficient deployments. Performance degradation Deploying new versions of applications can sometimes lead to unexpected performance degradation.
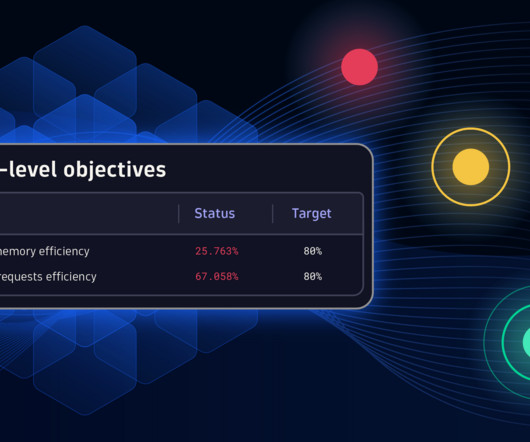
Part one also provided an overview of Dynatrace’s Cloud Automation solution, Microsoft’s GitHub Actions , and open-source examples you can use and extend related to deployment and release monitoring. On the left are the set of specific metrics to be collected, known as Service level indicators (SLIs). Blog series use cases.
Kubernetes has become the leading container orchestration platform for organizations adopting opensource solutions to manage, scale, and automate application deployment. Adopting this powerful tool can provide strategic technological benefits to organizations — specifically DevOps teams. What is Kubernetes?
In my role as Developer and DevOps Advocate, I have the luxury of interacting with many different people on a daily basis. Whether these are open-source developers I meet through my work on the CNCF project Keptn or Dynatrace partners and customers who I try to help get the most out of their investment in our Software Intelligence platform.
The Dynatrace Software Intelligence Platform already comes with release analysis, version awareness , and Service Level Objective (SLO) support as part of the Dynatrace Cloud Automation solution , helping DevOps and SRE teams automate the delivery and operational decisions. Ready to create your first release validation automation?
Automatically collect and evaluate business, service, and architectural indicator metrics to promote or roll back deployments. Successful DevOps teams have figured out that “delivering more with less” requires careful management of release risks and automation to scale. SLO validation – ?Automatically Topics in this blog series.
Opensource software is likewise playing a larger role in cloud computing, which brings benefits and dilemmas: bad actors have ready access to opensource software and can identify new vulnerabilities to exploit. This includes collecting metrics, logs, and traces from all applications and infrastructure components.
The backflow of CI/CD workflow information also helps your DevOps teams quickly find faulty software deployments and react quickly to prevent and remediate critical outages. Simply drag and drop the Dynatrace Action into your CI pipeline and collect all your relevant metrics and events during each of the execution steps.
Used by organizations for everything from assigning support tickets to managing failover regimes, feature flags enable DevOps teams to release software faster and more reliably. Because it’s opensource, OpenFeature eliminates the need for organizations to build their own proprietary SDKs and APIs.
This innovative model supports continuous delivery in a consistent and reliable way and stays true to the DevOps goal of code moving across the pipeline with more automation and less, or minimal, human intervention. . 1 Performance-as-a-self-service at Pay P al . Try it today using Keptn . Here is a shortlist to get you started.
Application developers commonly leverage open-source software when building containerized applications. In fact, the market research firm Forrester says that the average container image is comprised of 70% open-source software.[1] 1] And unfortunately, open-source software is often fraught with security vulnerabilities.
Gartner has estimated that 70% of new cloud-native application monitoring will use opensource instrumentation by 2025. Dynatrace’s observability platform is an example of how OpenTelemetry metrics can be enhanced for better visibility. ” Extended visibility. At industrial supply giant W.W. Getting to OpenTelemetry.
For DevOps teams that have an established production CI/CD pipeline , a service mesh can be essential for programmatically deploying apps and application infrastructure (Kubernetes) to manage source code and test automation tools like Git, Jenkins, Artifactory, or Selenium.
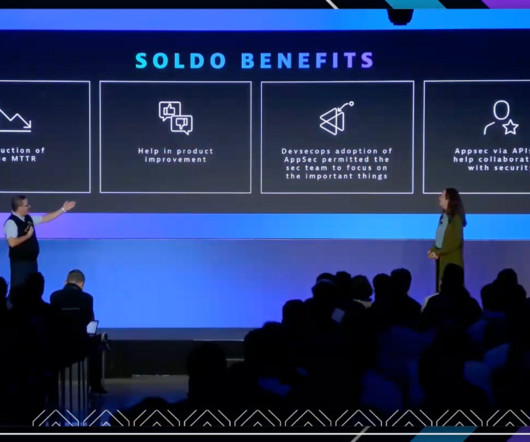
This is especially true as organizations rely more on diverse and nimble cloud-native and opensource technologies. We believe at Soldo that efficiency is the key value to be very successful in the business we run,” said Luca Domenella, head of cloud operations and DevOps at Soldo. The most efficient one we found was Dynatrace.”
Every service and component exposes observability data (metrics, logs, and traces) that contains crucial information to drive digital businesses. The “three pillars of observability,” metrics, logs, and traces, still don’t tell the whole story. Now, Dynatrace applies Davis, its AI engine, to monitor the new log sources.
In the last several years, I’ve led many sessions on DevOps, NoOps, Continuous Delivery, Continuous Performance, Shift-Left, Self-Healing, and GitOps. Zeroing in on the current state of DevOps and autonomous cloud and advancing performance. Reduce risk and iterate faster – the right way to deploy canary, blue/green and feature flags.
IT, DevOps, and SRE teams are racing to keep up with the ever-expanding complexity of modern enterprise cloud ecosystems and the business demands they are designed to support. With traditional monitoring tools, metrics, logs, traces, and user experience data is stored in data silos without context that ties them together to provide meaning.
If you work in software development, SRE, or DevOps, you’ve likely heard the terms observability, telemetry, and tracing. OpenTelemetry is an opensource observability project that encompasses a set of APIs, libraries, agents, and instrumentation standards. There are three main types of telemetry data: Metrics.
Generative AI: A type of AI that uses an algorithm trained on large amounts of data collected from diverse sources to generate various types of content, including text, images, audio, and synthetic data. And for DevOps, it means accelerating DevOps processes, improving agility, and speeding time to market.
IT, DevOps, and SRE teams seeking to know the health of their apps and services have always faced obstacles that can drain productivity, stifle collaboration, ratchet up the time to resolution, and limit the effectiveness of their collaboration with other parts of the business. Dynatrace news.
How Mitchells & Butlers brought the business together with DevOpsmetrics from Dynatrace – blog Many organizations are undergoing a digital transformation. DevOpsmetrics and digital experience data are critical to this. Learn more. Here is what they reported.
Although GCF adds needed flexibility to serverless application development, it can also pose observability challenges for DevOps teams. Avoid lock-in with open-source technologies. GCF is part of the Google Cloud Platform. Where does Google Cloud Functions fit in the GCP environment? How Google Cloud Functions works.
Software companies who have already been following and adopting DevOps and site reliability engineering (SRE) practices alongside their shared ancestry in agile concepts came out on top – especially if they adopted those practices across the whole organization and customer value stream. Automated release inventory and version comparison.
Here we present a list of 10 open-source Kubernetes tools to make your SRE and Ops teams more effective to achieve their service level objectives. Marmot is a workflow execution engine from Google for processing workflows targeting DevOps/SRE needs. Kube-ops-view. With Stern, the result is color-coded for quicker debugging.
Not just logs, metrics and traces. Its approach to serverless computing has transformed DevOps. Dynatrace provides new AIOps capabilities for all data sources, including open-source observability data via OpenTelemetry and Prometheus. DevOps/DevSecOps with AWS. 2021 DevOps Report. Learn more here.
Similar to the observability desired for a request being processed by your digital services, it’s necessary to comprehend the metrics, traces, logs, and events associated with a code change from development through to production. These phases must be aligned with security best practices, as discussed in A Beginner`s Guide to DevOps.
Gone are the days for Christian manually looking at dashboards and metrics after a new build got deployed into a testing or acceptance environment: Integrating Keptn into your existing DevOps tools such as GitLab is just a matter of an API call.
This guest blog is authored by Raphael Pionke , DevOps Engineer at T-Systems MMS. In white-box testing, we combine open-source load testing tools such as JMeter with Dynatrace’s observability and analytics capabilities. It automatically sends JMeter metrics to the Dynatrace cluster via the Metrics Ingest API.
Kubernetes is a widely used opensource system for container orchestration. It’s important to choose the right metrics to track based on your objective. It allows for seamless running of containerized workloads across different environments.
We organize all of the trending information in your field so you don't have to. Join 5,000+ users and stay up to date on the latest articles your peers are reading.
You know about us, now we want to get to know you!
Let's personalize your content
Let's get even more personalized
We recognize your account from another site in our network, please click 'Send Email' below to continue with verifying your account and setting a password.


Let's personalize your content