This site uses cookies to improve your experience. To help us insure we adhere to various privacy regulations, please select your country/region of residence. If you do not select a country, we will assume you are from the United States. Select your Cookie Settings or view our Privacy Policy and Terms of Use.
Cookie Settings
Cookies and similar technologies are used on this website for proper function of the website, for tracking performance analytics and for marketing purposes. We and some of our third-party providers may use cookie data for various purposes. Please review the cookie settings below and choose your preference.
Used for the proper function of the website
Used for monitoring website traffic and interactions
Cookie Settings
Cookies and similar technologies are used on this website for proper function of the website, for tracking performance analytics and for marketing purposes. We and some of our third-party providers may use cookie data for various purposes. Please review the cookie settings below and choose your preference.
Strictly Necessary: Used for the proper function of the website
Performance/Analytics: Used for monitoring website traffic and interactions
DevOps and security teams managing today’s multicloud architectures and cloud-native applications are facing an avalanche of data. On average, organizations use 10 different tools to monitor applications, infrastructure, and user experiences across these environments.
Over the past decade, DevOps has emerged as a new tech culture and career that marries the rapid iteration desired by software development with the rock-solid stability of the infrastructure operations team. As of August 2019, there are currently over 50,000 LinkedIn DevOps job listings in the United States alone.
With the world’s increased reliance on digital services and the organizational pressure on IT teams to innovate faster, the need for DevOps monitoring tools has grown exponentially. But when and how does DevOps monitoring fit into the process? And how do DevOps monitoring tools help teams achieve DevOps efficiency?
DevOps automation can help to drive reliability across the SDLC and accelerate time-to-market for software applications and new releases. What is DevOps automation? DevOps automation is a set of tools and technologies that perform routine, repeatable tasks that engineers would otherwise do manually.
As cloud-native, distributed architectures proliferate, the need for DevOps technologies and DevOps platform engineers has increased as well. DevOps engineer tools can help ease the pressure as environment complexity grows. ” What does a DevOps platform engineer do? ” What does a DevOps platform engineer do?
Protecting IT infrastructure, applications, and data requires that you understand security weaknesses attackers can exploit. Examples of such weaknesses are errors in application code, misconfigured network devices, and overly permissive access controls in a database. NMAP is an example of a well-known open-source network scanner.
You have set up a DevOps practice. As we look at today’s applications, microservices, and DevOps teams, we see leaders are tasked with supporting complex distributed applications using new technologies spread across systems in multiple locations. DevOps metrics to help you meet your DevOps goals. Dynatrace news.
More than 90% of enterprises now rely on a hybrid cloud infrastructure to deliver innovative digital services and capture new markets. That’s because cloud platforms offer flexibility and extensibility for an organization’s existing infrastructure. Dynatrace news. With public clouds, multiple organizations share resources.
As the new standard of monitoring, observability enables I&O, DevOps, and SRE teams alike to gain critical insights into the performance of today’s complex cloud-native environments. Observability defined. The case for observability. The architects and developers who create the software must design it to be observed.
If you’re doing it right, cloud represents a fundamental change in how you build, deliver and operate your applications and infrastructure. And that includes infrastructure monitoring. This also implies a fundamental change to the role of infrastructure and operations teams. Able to provide answers, not just data.
For organizations running their own on-premises infrastructure, these costs can be prohibitive. Cloud service providers, such as Amazon Web Services (AWS) , can offer infrastructure with five-nines availability by deploying in multiple availability zones and replicating data between regions. What is always-on infrastructure?
Endpoints include on-premises servers, Kubernetes infrastructure, cloud-hosted infrastructure and services, and open-source technologies. Observability across the full technology stack gives teams comprehensive, real-time insight into the behavior, performance, and health of applications and their underlying infrastructure.
This modular microservices-based approach to computing decouples applications from the underlying infrastructure to provide greater flexibility and durability, while enabling developers to build and update these applications faster and with less risk. A service mesh can solve these problems, but it can also introduce its own issues.
There are certain situations when an agent based approach isn’t possible, such as with network or storage devices, or a very old OS. In those cases, what should you do if you want to be proactive and ensure that your infrastructure is always up and running? Easy and flexible infrastructure monitoring.
ITOps is an IT discipline involving actions and decisions made by the operations team responsible for an organization’s IT infrastructure. Besides the traditional system hardware, storage, routers, and software, ITOps also includes virtual components of the network and cloud infrastructure. ITOps vs. DevOps and DevSecOps.
For Federal, State and Local agencies to take full advantage of the agility and responsiveness of a DevOps approach to the software lifecycle, Security must also play an integral role across lifecycle stages. Modern DevOps permits high velocity development cycles resulting in weekly, daily, or even hourly software releases.
Think of containers as the packaging for microservices that separate the content from its environment – the underlying operating system and infrastructure. The time and effort saved with testing and deployment are a game-changer for DevOps. Networking. In production, containers are easy to replicate.
A log is a detailed, timestamped record of an event generated by an operating system, computing environment, application, server, or network device. DevOps teams often use a log monitoring solution to ingest application, service, and system logs so they can detect issues at any phase of the software delivery life cycle (SDLC).
Indeed, according to one survey, DevOps practices have led to 60% of developers releasing code twice as quickly. Increased adoption of Infrastructure as code (IaC). IaC, or software intelligence as code , codifies and manages IT infrastructure in software, rather than in hardware. and 2.14.1.
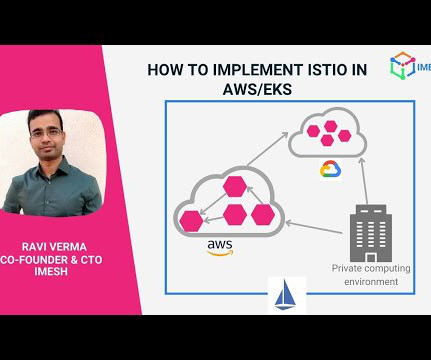
With many microservices deployed across multicloud and hybrid infrastructure (cloud, containers, and VMs), the manageability of the network becomes challenging. The transactions among services happen on the public network, so the sensitivity of the matter increases magnitudinally with rising incidents of hacking and cyberattacks.
From business operations to personal communication, the reliance on software and cloud infrastructure is only increasing. They may stem from software bugs, cyberattacks, surges in demand, issues with backup processes, network problems, or human errors. Outages can disrupt services, cause financial losses, and damage brand reputations.
Without the ability to see the logs that are relevant to your service, infrastructure, or cloud function—at exactly the right time and in exactly the right format—your cloud or DevOps engineers lose the ability to find the root causes of the issues they troubleshoot. Managing this change is difficult.
Most infrastructure and applications generate logs. In short, log management is how DevOps professionals and other concerned parties interact with and manage the entire log lifecycle. Optimally stored logs enable DevOps, SecOps, and other IT teams to access them easily. Why log management matters for your organization.
In the Advancing DevOps and DevSecOps track, sessions aim to help security pros, developers, and engineers as they brace for new threats that are costly and time-consuming to address. can grant access to internal networks, and if exploited, makes networks, applications, and devices susceptible to data theft and malware attacks.
With the advent of microservices, cloud, and containers, architects and the DevOps team need to reimagine and rethink how to simplify the network complexity and achieve zero-trust network security before one is in deep waters.
Automate DevOps pipelines to create better software faster to free up critical DevOps and IT time for new initiatives and innovation. Consider how AI-enabled chatbots such as ChatGPT and Google Bard help DevOps teams write code snippets or resolve problems in custom code without time-consuming human intervention.
How site reliability engineering affects organizations’ bottom line SRE applies the disciplines of software engineering to infrastructure management, both on-premises and in the cloud. There are now many more applications, tools, and infrastructure variables that impact an application’s performance and availability.
Adopting this powerful tool can provide strategic technological benefits to organizations — specifically DevOps teams. The platform aims to help DevOps teams optimize the allocation of compute resources across all containerized workloads in deployment. Networking. Observability. Containers need to spin up and down easily.
Digital workers are now demanding IT support to be more proactive,” is a quote from last year’s Gartner Survey Understandably, a higher number of log sources and exponentially more log lines would overwhelm any DevOps, SRE, or Software Developer working with traditional log monitoring solutions.
The segmentation between SecOps, who identifies misconfigurations, and DevOps, who implements the remediations, can further delay this process and lead to longer risk exposure. Addressing these challenges proactively is critical to maintaining a secure and efficient cloud infrastructure.
Native support for Syslog messages Syslog messages are generated by default in Linux and Unix operating systems, security devices, network devices, and applications such as web servers and databases. Native support for syslog messages extends our infrastructure log support to all Linux/Unix systems and network devices.
Figure 1 Investment shift from infrastructure-centric to application-centric. We start with metrics, traces, and logs (that’s table stakes) but also provide context and enrichment through topology, behavior, code, metadata, and network, combined with data from application programming interfaces (API) and OpenTelemetry.
Lambda serverless functions help developers innovate faster, scale easier, and reduce operational overhead, removing the burden of managing underlying infrastructure when updating and deploying code. Automatic observability and root-cause analysis for DevOps, cloud, and apps teams. What is Lambda? What is Lambda SnapStart?
Early in my IT career, I worked in IT Ops and DevOps roles, building release deployment solutions for repeatable outcomes. To begin this prescriptive approach, we perform the initial deployment of infrastructure and applications with Ansible Automation Platform, providing a more consistent and predictable environment.
Log data provides a unique source of truth for debugging applications, optimizing infrastructure, and investigating security incidents. Collecting logs that aren’t relevant to their business case creates noise, overloads congested networks, and slows down teams. Every manual step in growing enterprise environments becomes a hurdle.
Using environment automation from both AWS and Dynatrace, supported by the AWS Infrastructure Event Management program , Dynatrace University successfully delivered the required environments – these were three times more than the conference the year before. Perform 2020 Infrastructure Setup. True DevOps culture in action!
It also enables DevOps teams to connect to any number of AWS services or run their own functions. Organizations can offload much of the burden of managing app infrastructure and transition many functions to the cloud by going serverless with the help of Lambda. Where does Lambda fit in the AWS ecosystem?
To function effectively, containers need to be able to communicate with each other and with network services. If containers are run with privileged flags, or if they receive details about host processes, they can easily become points of compromise for corporate networks. Network scanners. Let’s look at each type.
” Moreover, as modern DevOps practices have increased the speed of software delivery, more than two-thirds (69%) of chief information security officers (CISOs) say that managing risk has become more difficult. For example, an attacker could exploit a misconfigured firewall rule to gain access to servers on your network.
In particular, achieving observability across all containers controlled by Kubernetes can be laborious for even the most experienced DevOps teams. It automates complex tasks during the container’s life cycle, such as provisioning, deployment, networking, scaling, load balancing, and more. Who manages the networking aspects?
Serving as agreed-upon targets to meet service-level agreements (SLAs), SLOs can help organizations avoid downtime, improve software quality, and promote automation in the DevOps lifecycle. In this post, I’ll lay out five foundational service level objective examples that every DevOps and SRE team should consider.
With Dynatrace’s full-stack monitoring capabilities, organizations can assess how underlying infrastructure resources affect the application’s performance. Using a data-driven approach to size Azure resources, Dynatrace OneAgent captures host metrics out-of-the-box to assess CPU, memory, and network utilization on a VM host.
And, this is even more apparent due to the ever-increasing infrastructure complexity enterprises are dealing with. On-demand infrastructure: The ability to deploy infrastructure whenever it’s required. Many of our principles are based on Autonomous Cloud Management (ACM) which is a methodology built around Everything as Code.
With Grail, for example, a DevOps team can pre-scan logs. With this process, DevOps teams can identify whether code includes a high-priority bug that has to be fixed immediately. The Dynatrace team gathered cloud billing data, infrastructure data, networking data, and analyzed that data in Dynatrace Notebooks.
We organize all of the trending information in your field so you don't have to. Join 5,000+ users and stay up to date on the latest articles your peers are reading.
You know about us, now we want to get to know you!
Let's personalize your content
Let's get even more personalized
We recognize your account from another site in our network, please click 'Send Email' below to continue with verifying your account and setting a password.


Let's personalize your content