This site uses cookies to improve your experience. To help us insure we adhere to various privacy regulations, please select your country/region of residence. If you do not select a country, we will assume you are from the United States. Select your Cookie Settings or view our Privacy Policy and Terms of Use.
Cookie Settings
Cookies and similar technologies are used on this website for proper function of the website, for tracking performance analytics and for marketing purposes. We and some of our third-party providers may use cookie data for various purposes. Please review the cookie settings below and choose your preference.
Used for the proper function of the website
Used for monitoring website traffic and interactions
Cookie Settings
Cookies and similar technologies are used on this website for proper function of the website, for tracking performance analytics and for marketing purposes. We and some of our third-party providers may use cookie data for various purposes. Please review the cookie settings below and choose your preference.
Strictly Necessary: Used for the proper function of the website
Performance/Analytics: Used for monitoring website traffic and interactions
Dynatrace Simple Workflows make this process automatic and frictionlessthere is no additional cost for workflows. Why manual alerting falls short As your product and deployments scale horizontally and vertically, the sheer volume of data makes it impossible for teams to catch every error quickly using manual processes.
Developers are key stakeholders in modern observability. In this blog post, we will see how Dynatrace harnesses the power of observability and analytics to tailor a new experience to easily extend to the left, allowing developers to solve issues faster, build more efficient software, and ultimately improve developer experience!
Business processes support virtually all aspects of an organizations operations. Theyre often categorized by their function; core processes directly create customer value, support processes increase departmental efficiency, and management processes drive strategic goals and compliance.
Day two of Dynatrace Perform began with a great discussion between Kelsey Hightower , Distinguished Developer Advocate at Google Cloud Platform and Andi Grabner , DevOps Evangelist at Dynatrace. The theme of their discussion was redefining the boundaries of people, processes and platforms.
The business process observability challenge Increasingly dynamic business conditions demand business agility; reacting to a supply chain disruption and optimizing order fulfillment are simple but illustrative examples. Most business processes are not monitored. First and foremost, it’s a data problem.
In all seriousness, the shift-left mantra has shaken things up quite a bit in the tech industry, bringing a paradigm shift in how we approach software development. Today, engineers are spending an increasing amount of time developing and testing code in production-like environments.
By which I mean it can make developers produce more. The question is whether those developers are producing something good or not. The difference between an experienced developer and a junior is that an experienced developer knows: There’s more than one good solution to every problem. This is great!
Today, development teams suffer from a lack of automation for time-consuming tasks, the absence of standardization due to an overabundance of tool options, and insufficiently mature DevSecOps processes. This leads to frustrating bottlenecks for developers attempting to build and deliver software.
Future blogs will provide deeper dives into each service, sharing insights and lessons learned from this process. The Netflix video processing pipeline went live with the launch of our streaming service in 2007. The Netflix video processing pipeline went live with the launch of our streaming service in 2007.
Every software developer has faced the frustration of debugging. A production bug is the worst; besides impacting customer experience, you need special access privileges, making the process far more time-consuming. This cumbersome process should not be the norm.
This three-part article series will take you through the process of developing a network anomaly detection system using the Spring Boot framework in a robust manner. The series is organized as follows: Part 1: We’ll concentrate on the foundation and basic structure of our detection system, which has to be created.
Processes are time-intensive. Slow processes introduce risk. Continuous visibility and assessment provide platform engineering, DevSecOps, DevOps, and SRE teams with the ability to track, validate, and remediate potential compliance-relevant findings and create the necessary evidence for the auditing process. Reactivity.
Ingress is essential for routing incoming traffic to your service; however, there may be scenarios in which you want to prevent search engines from indexing your service's content: it might be a development environment or something else.
Banks are facing challenges to make profits in today’s environment where technology development costs and interest rates are rising. One way to do this is by changing from proprietary tools-driven software development to open-source technology and automation, which eliminates licensing fees.
Using updated and relevant security knowledge, your software developers can be the first line of defense. Discover how to create an effective and engaging training program for your developers. Set Goals for Developers Writing code can be a time-consuming process.
Dynatrace transforms this unstructured data into a strategic advantage, processing it automatically—no manual tagging required. More time for teams to focus on developing new services and improving customer experience, all while keeping operational costs under control. With over 2.5 The result?
Consolidate real-user monitoring, synthetic monitoring, session replay, observability, and business process analytics tools into a unified platform. Real-time customer experience remediation identifies and informs the organization about any issues and prevents them in the experience process sooner.
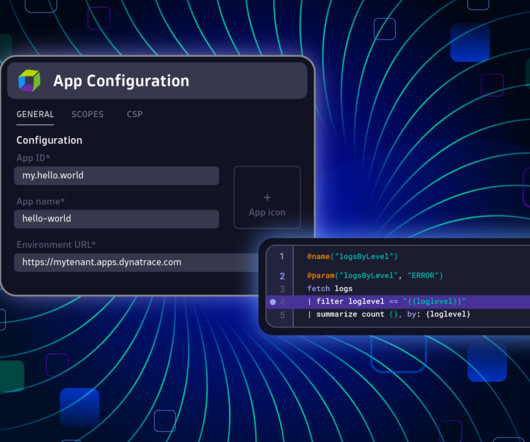
As an app developer, you have many recurring tasks: starting the development server, creating app functions, querying data stored in Grail, managing app configurations, and building and deploying apps. The VS Code extension Dynatrace Apps is here to streamline your developmentprocess and simplify app building.
According to recent research from TechTarget’s Enterprise Strategy Group (ESG), generative AI will change software development activities, from quality assurance to debugging to CI/CD pipeline configuration. On the whole, survey respondents view AI as a way to accelerate software development and to improve software quality.
At the 2024 Dynatrace Perform conference in Las Vegas, Michael Winkler, senior principal product management at Dynatrace, ran a technical session exploring just some of the many ways in which Dynatrace helps to automate the processes around development, releases, and operation. Real-time detection for fast remediation.
Application observability helps IT teams gain visibility in their highly distributed systems, but what is developer observability and why is it important? In a recent webinar , Dynatrace DevOps activist Andi Grabner and senior software engineer Yarden Laifenfeld explored developer observability. Observability is about answering.”
This blog post will explore these exciting developments and what they mean for organizations. This integration simplifies the process of embedding Dynatrace full-stack observability directly into custom Amazon Machine Images (AMIs). Together, Dynatrace and AWS are paving the way for more robust and agile cloud solutions.
As organizations look to expand DevOps maturity, improve operational efficiency, and increase developer velocity, they are embracing platform engineering as a key driver. The goal is to abstract away the underlying infrastructure’s complexities while providing a streamlined and standardized environment for development teams.
Developers could understand and manage the entire systems intricacies. Cloud-native environments, microservices, real-time data processing, and global user bases transformed back-end architecture from a simple technical challenge into a strategic business capability.
This blog post dissects the vulnerability, explains how Struts processes file uploads, details the exploit mechanics, and outlines mitigation strategies. Developers and security professionals should take immediate steps to ensure the security of their Struts-based applications. and later, where the legacy class is fully removed.
We recently announced Dynatrace Live Debugger , which gives developers unprecedented access to real-time data and runtime behavior insights. This powerful tool can be leveraged across various environments, including production, to enhance developmentprocesses and ensure robust application performance.
Weve seen this across dozens of companies, and the teams that break out of this trap all adopt some version of Evaluation-Driven Development (EDD), where testing, monitoring, and evaluation drive every decision from the start. Were also betting that this will be a time of software development flourishing. The way out?
Protect data in multi-tenant architectures To bring you the most value by unifying observability and security in one analytics and automation platform powered by AI, Dynatrace SaaS leverages a multitenancy architecture, enabling efficient and scalable data ingestion, querying, and processing on shared infrastructure.
The newly introduced step-by-step guidance streamlines the process, while quick data flow validation accelerates the onboarding experience even for power users. Step-by-step setup The log ingestion wizard guides you through the prerequisites and provides ready-to-use command examples to start the installation process. Figure 5.
Retaining multiple tools generates huge volumes of alerts for analysis and action, slowing down the remediation and risk mitigation processes. The process should include training technical and business users to maximize the value of the platform so they can access, ingest, analyze, and act on the new observability approach.
From developers leveraging platform engineering tools to optimize application performance, to Site Reliability Engineers (SREs) ensuring resilience, and executives gaining critical business insights, observability increases the velocity of innovation across every level of an organization.
Finally, it empowers automated systems to process and analyze OpenTelemetry data, without requiring adaptations for every framework. The specifications for OTLP and semconv for profiling are advancing rapidly, and an experimental Collector support has been developed.
Administrators who work with developers and product managers responsible for instrumenting, managing, and achieving the business goals of applications benefit from Dynatrace log management. Streamlined audits: End-to-end compliance simplifies the audit process.
By integrating Dynatrace with GitHub Actions, you can proactively monitor for potential issues or slowdowns in the deployment processes. Improving collaboration across teams By surfacing actionable insights and centralized monitoring data, Dynatrace fosters collaboration between development, operations, security, and business teams.
RabbitMQ is designed for flexible routing and message reliability, while Kafka handles high-throughput event streaming and real-time data processing. RabbitMQ follows a message broker model with advanced routing, while Kafkas event streaming architecture uses partitioned logs for distributed processing. What is Apache Kafka?
Findings from various stages of the Software Development Lifecycle (SDLC) are mixed in: code scans, build scans, and runtime. Moreover, findings can come from various types of environments: development, testing, and production. The main categories are detections, vulnerabilities, and compliance misconfigurations.
Using this data, developers can inspect local variables, server-process details, thread information, and trace data to identify the root cause of issues. In this case, the debugging process reveals there are background threads potentially consuming excessive CPU resources.
With these details, the issue is found, and they have the information needed to escalate the situation to their development teams and prioritize the creation and deployment of the needed fix. We’re rolling out this new functionality for our existing Dynatrace Platform Subscription (DPS) customers.
This is especially important in the modern world of web development, where it can be challenging for a site to load in a reasonable amount of time. It's to overcome this challenge that front-end performance has become the norm or optimization among developers.
However, due to the fact that they boil down selected indicators to single values and track error budget levels, they also offer a suitable way to monitor optimization processes while aligning on single values to meet overall goals. By recognizing the insights provided, you can optimize processes and improve overall efficiency.
P95 Response time over Time: A time series of how each service’s response time develops. In addition to service-level monitoring, certain services within the OpenTelemetry demo application expose process-level metrics, such as CPU and memory consumption, number of threads, or heap size for services written in different languages.
For instance, Dynatrace has developed the Cost and Carbon Optimization app, a tool designed to measure, understand, and act on the energy consumption and carbon emissions generated by hybrid and multicloud infrastructures. For example, reporting jobs can process monthly data without running exactly at the end of the month.
However, earlier implementations lacked flexibility, and developers had limited control over cache invalidation and customization. improve the process. Efficient query caching is a critical part of application performance in data-intensive systems. Hibernate 6.3.0, Hibernate 6.3.0,
To facilitate easier access to incrementality results, we have developed an interactive tool powered by this framework. To better guide the design and budgeting of future campaigns, we are developing an Incremental Return on Investment model. This makes it difficult to measure the impact of different game launches on acquisition.
We organize all of the trending information in your field so you don't have to. Join 5,000+ users and stay up to date on the latest articles your peers are reading.
You know about us, now we want to get to know you!
Let's personalize your content
Let's get even more personalized
We recognize your account from another site in our network, please click 'Send Email' below to continue with verifying your account and setting a password.


Let's personalize your content