This site uses cookies to improve your experience. To help us insure we adhere to various privacy regulations, please select your country/region of residence. If you do not select a country, we will assume you are from the United States. Select your Cookie Settings or view our Privacy Policy and Terms of Use.
Cookie Settings
Cookies and similar technologies are used on this website for proper function of the website, for tracking performance analytics and for marketing purposes. We and some of our third-party providers may use cookie data for various purposes. Please review the cookie settings below and choose your preference.
Used for the proper function of the website
Used for monitoring website traffic and interactions
Cookie Settings
Cookies and similar technologies are used on this website for proper function of the website, for tracking performance analytics and for marketing purposes. We and some of our third-party providers may use cookie data for various purposes. Please review the cookie settings below and choose your preference.
Strictly Necessary: Used for the proper function of the website
Performance/Analytics: Used for monitoring website traffic and interactions
The nirvana state of system uptime at peak loads is known as “five-nines availability.” In its pursuit, IT teams hover over system performance dashboards hoping their preparations will deliver five nines—or even four nines—availability. How can IT teams deliver system availability under peak loads that will satisfy customers?
The Federal Reserve Regulation HH in the United States focuses on operational resilience requirements for systemically important financial market utilities. Proactive systems like Dynatrace’s Davis AI can automate responses to threats, swiftly implementing remediation while keeping executives informed of actions taken and their impact.
.” While this methodology extends to every layer of the IT stack, infrastructure as code (IAC) is the most prominent example. Here, we’ll tackle the basics, benefits, and best practices of IAC, as well as choosing infrastructure-as-code tools for your organization. What is infrastructure as code?
Protect data in multi-tenant architectures To bring you the most value by unifying observability and security in one analytics and automation platform powered by AI, Dynatrace SaaS leverages a multitenancy architecture, enabling efficient and scalable data ingestion, querying, and processing on shared infrastructure.
Infrastructure monitoring is the process of collecting critical data about your IT environment, including information about availability, performance and resource efficiency. Many organizations respond by adding a proliferation of infrastructure monitoring tools, which in many cases, just adds to the noise. Dynatrace news.
And it enables executives to have unprecedented insight into how user experiences, applications and underlying infrastructure health can power their business. By automating root-cause analysis, TD Bank reduced incidents, speeding up resolution times and maintaining system reliability. The result?
The system is inconsistent, slow, hallucinatingand that amazing demo starts collecting digital dust. Weve seen this across dozens of companies, and the teams that break out of this trap all adopt some version of Evaluation-Driven Development (EDD), where testing, monitoring, and evaluation drive every decision from the start.
This rising risk amplifies the need for reliable security solutions that integrate with existing systems. Membership in MISA is nomination-only and reserved for independent software vendors who develop security solutions that effectively integrate with MISA-qualifying Microsoft Security products.
With Dashboards , you can monitor business performance, user interactions, security vulnerabilities, IT infrastructure health, and so much more, all in real time. Even if infrastructure metrics aren’t your thing, you’re welcome to join us on this creative journey simply swap out the suggested metrics for ones that interest you.
These releases often assumed ideal conditions such as zero latency, infinite bandwidth, and no network loss, as highlighted in Peter Deutsch’s eight fallacies of distributed systems. With Dynatrace, teams can seamlessly monitor the entire system, including network switches, database storage, and third-party dependencies.
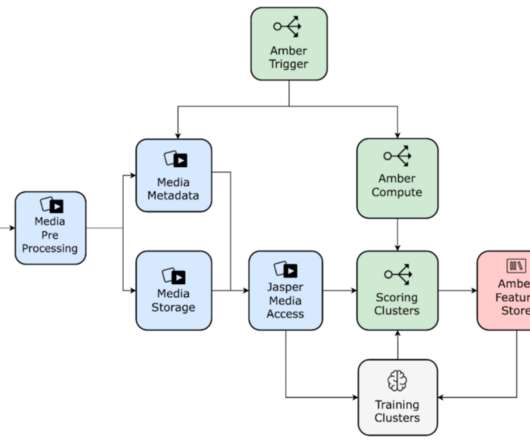
Berg , Romain Cledat , Kayla Seeley , Shashank Srikanth , Chaoying Wang , Darin Yu Netflix uses data science and machine learning across all facets of the company, powering a wide range of business applications from our internal infrastructure and content demand modeling to media understanding.
EdgeConnect provides a secure bridge for SaaS-heavy companies like Dynatrace, which hosts numerous systems and data behind VPNs. In this hybrid world, IT and business processes often span across a blend of on-premises and SaaS systems, making standardization and automation necessary for efficiency.
On top of this, organizations are often unable to accurately identify root causes across their dispersed and disjointed infrastructure. In such a fragmented landscape, having clear, real-time insights into granular data for every system is crucial.
Infrastructure as code is a way to automate infrastructure provisioning and management. In this blog, I explore how Dynatrace has made cloud automation attainable—and repeatable—at scale by embracing the principles of infrastructure as code. Infrastructure-as-code. But how does it work in practice?
How to achieve sustainable IT practices Use observability tools The first step in driving improvements is to obtain a comprehensive view of your IT infrastructure’s climate impact. Scale to zero Scaling systems to match current demand prevents underutilized machines from consuming significant energy while idling.
Effective application development requires speed and specificity. Applications must work as intended and make their way through development pipelines as quickly as possible. FaaS enables enterprises to deliver on the evolving expectations of fast and furious app development. But what is FaaS? How does function as a service work?
Security controls in the software development life cycle (SDL). Typically, the attackers attempt to exploit some weakness in the vendor’s development or delivery life cycle and attempt to inject malicious code before an application is signed and certified. Security controls in the software development life cycle (SDL).
Log management is an organization’s rules and policies for managing and enabling the creation, transmission, analysis, storage, and other tasks related to IT systems’ and applications’ log data. Most infrastructure and applications generate logs. How log management systems optimize performance and security.
Introduction to Message Brokers Message brokers enable applications, services, and systems to communicate by acting as intermediaries between senders and receivers. This decoupling simplifies system architecture and supports scalability in distributed environments.
Many of these projects are under constant development by dedicated teams with their own business goals and development best practices, such as the system that supports our content decision makers , or the system that ranks which language subtitles are most valuable for a specific piece ofcontent.
Application observability helps IT teams gain visibility in their highly distributed systems, but what is developer observability and why is it important? In a recent webinar , Dynatrace DevOps activist Andi Grabner and senior software engineer Yarden Laifenfeld explored developer observability. Observability is about answering.”
Dynatrace enables our customers to monitor and optimize their cloud infrastructure and applications through the Dynatrace Software Intelligence Platform. Today’s story is about how the Keptn development team is using Dynatrace during development and load-testing. Conclusion: Dynatrace is always on for us developers.
The concept of observability involves understanding a system’s internal states through the examination of logs, metrics, and traces. This approach provides a comprehensive system view, allowing for a thorough investigation and analysis. While incorporating observability into a system may seem daunting, the benefits are significant.
Enhanced observability and release validation Dynatrace already excels at delivering full-stack, end-to-end observability of your systems and user journeys. Inefficient or resource-intensive runners can lead to increased costs and underutilized infrastructure.
By Ko-Jen Hsiao , Yesu Feng and Sudarshan Lamkhede Motivation Netflixs personalized recommender system is a complex system, boasting a variety of specialized machine learned models each catering to distinct needs including Continue Watching and Todays Top Picks for You. Refer to our recent overview for more details).
This tier extended existing infrastructure by adding new backend components and a new remote call to our ads partner on the playback path. Replay traffic enabled us to test our new systems and algorithms at scale before launch, while also making the traffic as realistic as possible.
As businesses take steps to innovate faster, software development quality—and application security—have moved front and center. Indeed, according to one survey, DevOps practices have led to 60% of developers releasing code twice as quickly. Increased adoption of Infrastructure as code (IaC).
As dynamic systems architectures increase in complexity and scale, IT teams face mounting pressure to track and respond to conditions and issues across their multi-cloud environments. The architects and developers who create the software must design it to be observed. Dynatrace news.
Findings provide insights into Kubernetes practitioners’ infrastructure preferences and how they use advanced Kubernetes platform technologies. As Kubernetes adoption increases and it continues to advance technologically, Kubernetes has emerged as the “operating system” of the cloud. Kubernetes moved to the cloud in 2022.
Kubernetes is a widely used open source system for container orchestration. By gaining insights into how your Kubernetes workloads utilize computing and memory resources, you can make informed decisions about how to size and plan your infrastructure, leading to reduced costs.
From business operations to personal communication, the reliance on software and cloud infrastructure is only increasing. Ransomware encrypts essential data, locking users out of systems and halting operations until a ransom is paid. Outages can disrupt services, cause financial losses, and damage brand reputations.
Kubernetes simplifies the operation and development of distributed applications by streamlining the deployment of containerized workloads and distributing them over a set of nodes. Traces help find the flow of a request through a distributed system. Based on this analysis, these systems can take actions such as alerting or remediation.
Our goal in building a media-focused ML infrastructure is to reduce the time from ideation to productization for our media ML practitioners. This feature store is equipped with a data replication system that enables copying data to different storage solutions depending on the required access patterns.
The DevOps playbook has proven its value for many organizations by improving software development agility, efficiency, and speed. These methods improve the software development lifecycle (SDLC), but what if infrastructure deployment and management could also benefit? GitOps also requires extensive approvals for any development.
Sometimes overlooked is a fourth category we might call long-tail processes; these are the ad hoc or custom workflows that develop in response to gaps between systems, applications, departments, or workflows. API to ingest data from relevant business systems. RUM for high-precision user journey analytics.
Serverless architecture is a way of building and running applications without the need to manage infrastructure. Reduced operational overhead: Developers can focus purely on writing code and pushing updates, rather than worrying about server upkeep. When we talk about " serverless ," it doesn't mean servers are absent.
This blog post explains how Dynatrace simplifies log ingestion, whether youre onboarding logs from your infrastructure using OneAgent, cloud services using log forwarding, or driving open-source standardization leveraging OpenTelemetry (OTel), Fluent Bit, or any other API-based ingestion methods. You can add additional logs at any time.
Certification by an independent assessor includes an audit of the company’s information security measures, including its infrastructure, processes, and data protection practices. The certification is issued by ENX , a well-known German association, and is globally recognized 1.
Observability of applications and infrastructure serves as a critical foundation for DevOps and platform engineering, offering a comprehensive view into system performance and behavior. AI helps provide in-depth context around system issues, anomalies, and other events instead of merely identifying them.
The development of internal platform teams has taken off in the last three years, primarily in response to the challenges inherent in scaling modern, containerized IT infrastructures. Platform engineering best practices for delivering a highly available, secure, and resilient Internal Development Platform: Centralize and standardize.
For IT infrastructure managers and site reliability engineers, or SREs , logs provide a treasure trove of data. Logs assist operations, security, and development teams in ensuring the reliability and performance of application environments. The advantage of an index-free system in log analytics and log management.
In today’s digital-first world, data resides across dozens of different IT systems, from critical business applications to the modern cloud platforms that underpin them. These capabilities are essential to providing real-time oversight of the infrastructure and applications that support modern business processes.
IBM i, formerly known as iSeries, is an operating systemdeveloped by IBM for its line of IBM i Power Systems servers. It is based on the IBM AS/400 system and is known for its reliability, scalability, and security features. The extension runs remotely from your Dynatrace ActiveGates and connects to your IBM i system.
A log is a detailed, timestamped record of an event generated by an operating system, computing environment, application, server, or network device. Logs can include data about user inputs, system processes, and hardware states. “Logging” is the practice of generating and storing logs for later analysis.
We organize all of the trending information in your field so you don't have to. Join 5,000+ users and stay up to date on the latest articles your peers are reading.
You know about us, now we want to get to know you!
Let's personalize your content
Let's get even more personalized
We recognize your account from another site in our network, please click 'Send Email' below to continue with verifying your account and setting a password.


Let's personalize your content