This site uses cookies to improve your experience. To help us insure we adhere to various privacy regulations, please select your country/region of residence. If you do not select a country, we will assume you are from the United States. Select your Cookie Settings or view our Privacy Policy and Terms of Use.
Cookie Settings
Cookies and similar technologies are used on this website for proper function of the website, for tracking performance analytics and for marketing purposes. We and some of our third-party providers may use cookie data for various purposes. Please review the cookie settings below and choose your preference.
Used for the proper function of the website
Used for monitoring website traffic and interactions
Cookie Settings
Cookies and similar technologies are used on this website for proper function of the website, for tracking performance analytics and for marketing purposes. We and some of our third-party providers may use cookie data for various purposes. Please review the cookie settings below and choose your preference.
Strictly Necessary: Used for the proper function of the website
Performance/Analytics: Used for monitoring website traffic and interactions
Designing and maintaining, like any other large-scale framework, requires deep thinking and constant monitoring. This design keeps the components independent of each other, making the system easier to scale and maintain. This approach makes systems reactive, scalable, and resilient to failures.
Let’s explore some of the advantages of monitoring GitHub runners using Dynatrace. By integrating Dynatrace with GitHub Actions, you can proactively monitor for potential issues or slowdowns in the deployment processes. Extending this visibility into your CI/CD pipelines offers even greater value.
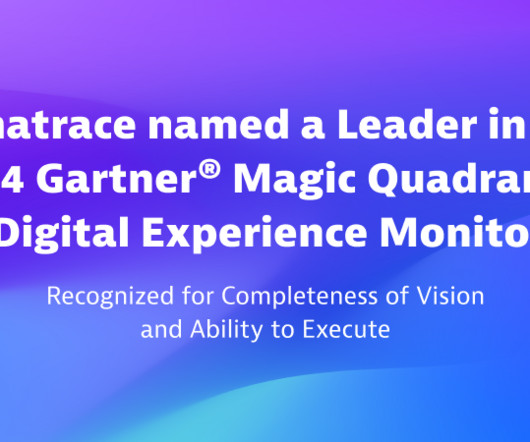
We’re excited to announce that Dynatrace has been named a Leader in the inaugural 2024 Gartner® Magic Quadrant™ for Digital Experience Monitoring. Dynatrace digital experience monitoring (DEM) monitors and analyzes the quality of digital experiences for users across digital channels by collecting data from multiple sources.
This year’s AWS re:Invent will showcase a suite of new AWS and Dynatrace integrations designed to enhance cloud performance, security, and automation. By automating OneAgent deployment at the image creation stage, organizations can immediately equip every EC2 instance with real-time monitoring and AI-powered analytics.
In fact, observability is essential for shaping how we design smarter, more resilient systems for the future. OpenTelemetry is enhancing GenAI observability : By defining semantic conventions for GenAI and implementing Python-based instrumentation for OpenAI, OpenTel is moving towards addressing GenAI monitoring and performance tuning needs.
In addition to automatic full-stack monitoring, Dynatrace provides comprehensive support for all AWS services that publish metrics to Amazon CloudWatch, providing advanced observability for dynamic hybrid clouds. We’re therefore excited to announce that Dynatrace has received the AWS Outposts Service Ready designation.
Manual approaches lack continuous monitoring, making them ill-equipped to prevent issues before they arise. The time has come to move beyond outdated practices and adopt solutions designed for the realities of Kubernetes environments. This empowers teams to efficiently deliver secure, compliant Kubernetes applications by design.
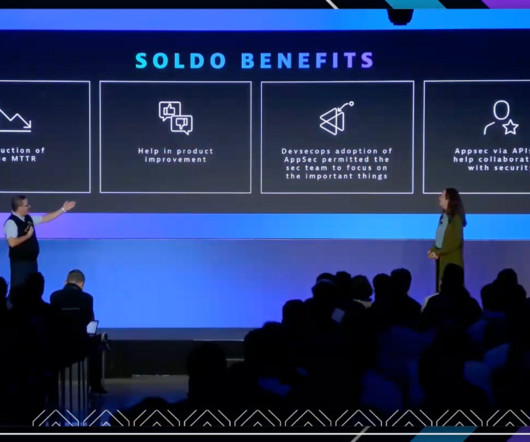
At financial services company, Soldo, efficiency and security by design are paramount goals. These practices include observability, application security, Kubernetes monitoring, and microservices migration. Because Soldo is in a highly regulated industry, Domenella’s team adopted security by design from the beginning.
Metis has built an AI-driven database observability platform designed for developers and SREs. For SREs, this means better proactive monitoring, fewer database-related incidents, and greater stability in production environments. That’s why I’m thrilled to welcome Metis to Dynatrace.
Dynatrace has announced that it has successfully achieved the Google Cloud Ready – Cloud SQL designation for Cloud SQL, Google Cloud’s fully-managed, relational database service for MySQL, PostgreSQL, and SQL Server. This designation can also save time in evaluating Dynatrace solutions for organizations that are not already using them.
Combined with Microsoft Sentinel, Dynatrace automation and AI capabilities provide SecOps teams with deeper intelligence to detect attacks, vulnerabilities, audit logs, and problem events based on metrics, logs, and traces it collects from monitored environments. Runtime application protection.
Do Not Wait With Checks Teams aim to maintain continuous database reliability, focusing on ensuring their designs perform well in production, scale effectively, and allow for safe code deployments.
The system demands significant effort to design, manage, and maintain, especially as an organization’s needs evolve. Access policies for Dynatrace Grail™ data lakehouse are still available as service-related policies; they allow you to control access to the monitoring data on a per-data-source level, for example, logs and metrics.
With the pace of digital transformation continuing to accelerate, organizations are realizing the growing imperative to have a robust application security monitoring process in place. What are the goals of continuous application security monitoring and why is it important?
In this article, I reported my experience working on large applications and how monitoring came into my journey when I started producing software designed to solve business-critical problems.
An hourly rate for Infrastructure Monitoring The Dynatrace Platform Subscription (DPS) offers a flat rate for Infrastructure Monitoring , providing observability for cloud platforms, containers, networks, and data center technologies with no limits on host memory and with AIOps included.
A cornerstone of Dynatrace monitoring capabilities, OneAgent boosts your log ingestion experience by automatically detecting and tagging logs based on the detected process technologyeven for custom-developed applications. Ready to consolidate your logs and monitoring tools in Dynatrace? Configuration is fully customizable.
IBM i is designed to integrate seamlessly with legacy and modern applications, allowing businesses to run critical workloads and applications. It’s all monitored remotely ! Get a health overview of each system Monitor your system’s performance and detect unexpected events such as IPLs, CPU spikes, and exceeded total job limits.
One of the more popular use cases is monitoring business processes, the structured steps that produce a product or service designed to fulfill organizational objectives. The Business Flow app Business Flow, built with AppEngine, simplifies the configuration, monitoring, and analysis of business processes.
Real user monitoring can help you catch these issues before they impact the bottom line. What is real user monitoring? Real user monitoring (RUM) is a performance monitoring process that collects detailed data about a user’s interaction with an application. Real user monitoring collects data on a variety of metrics.
Built and maintained by Oracle, it provides an all-in-one solution for database modeling, query execution, user administration, and performance monitoring. Its designed primarily for Windows users, but many developers use it on other platforms via Wine. Its a solid choice if you want a full-featured MySQL development environment.
Creating an ecosystem that facilitates data security and data privacy by design can be difficult, but it’s critical to securing information. When organizations focus on data privacy by design, they build security considerations into cloud systems upfront rather than as a bolt-on consideration.
How To Design For High-Traffic Events And Prevent Your Website From Crashing How To Design For High-Traffic Events And Prevent Your Website From Crashing Saad Khan 2025-01-07T14:00:00+00:00 2025-01-07T22:04:48+00:00 This article is sponsored by Cloudways Product launches and sales typically attract large volumes of traffic.
While if limits are set too high, you might pay for more monitoring than you need and exceed your budget. Cost monitors notify you of changes to your forecast usage Cost monitors offer a different approach to these challenges. Cost monitors run in the background daily, automatically monitoring usage forecasts and costs.
Monitoring Kubernetes is an important aspect of Day 2 o perations and is often perceived as a significant challenge. O ne of the principles behind the design of Kubernetes is to always look at optimiz ing the utilization of compute resources by the workload. Monitoring in the Kubernetes world .
Business events: Delivering the best data It’s been two years since we introduced business events , a special class of events designed to support even the most demanding business use cases. Business process monitoring and optimization. Want to see how we use business events from log files to support business process monitoring?
These resources generate vast amounts of data in various locations, including containers, which can be virtual and ephemeral, thus more difficult to monitor. These challenges make AWS observability a key practice for building and monitoring cloud-native applications. AWS monitoring best practices. What is AWS observability?
They offer a comprehensive end-to-end solution to these challenges, providing functionalities designed to enhance compliance and resilience in IT environments. It gives you visibility into which components are monitored and which are not and helps automate time-consuming compliance configuration checks.
The Apollo router is a powerful routing solution designed to replace the GraphQL Gateway. This plugin is responsible for sending traces and logs to the appropriate endpoints, making it an essential component of the performance monitoring process.
As organizations migrate their workloads to the cloud, robust monitoring and management tools are paramount to ensure optimal performance, security, and efficiency. AMA is a lightweight yet potent agent that plays a crucial role in collecting and transmitting telemetry data from various resources within the Azure ecosystem.
In this blog post, we look at these enhancements, exploring methods for monitoring your Kubernetes environment and showcasing how modern dashboards can transform your data. Leverage dashboards to monitor your environment in real time through log data.
With Dashboards , you can monitor business performance, user interactions, security vulnerabilities, IT infrastructure health, and so much more, all in real time. Follow along to create this host monitoring dashboard We will create a basic Host Monitoring dashboard in just a few minutes. Create a new dashboard.
Observability is no longer just for IT Ops Observability is no longer just about monitoring IT systems. As organizations accelerate AI adoption, they need reliable ways to monitor and optimize AI workloads. wanted to take a moment to expandon thekey themes we touched on in our conversation.
Digital experience monitoring (DEM) allows an organization to optimize customer experiences by taking into account the context surrounding digital experience metrics. What is digital experience monitoring? Primary digital experience monitoring tools.
Implement proactive monitoring for each of these endpoints. Key Features Proactive monitoring through scheduled collectors jobs Our Title Health microservice runs a scheduled collector job every 30 minutes for most of our personalization stack. Track real-time title impressions from the NetflixUI. there is a dedicated collector.
Automated AI-powered analytics are necessary to match the scale of monitoring these enterprises require. Our journey began in 2019 with the introduction of the Dynatrace Citrix monitoring extension. Listen, learn, improve, and repeat The latest update to the Citrix monitoring extension is now available.
RabbitMQ is designed for flexible routing and message reliability, while Kafka handles high-throughput event streaming and real-time data processing. RabbitMQ can be deployed in distributed environments and includes monitoring tools through a built-in dashboard and CLI.
Dynatrace is proud to provide deep monitoring support for Azure Linux as a container host operating system (OS) platform for Azure Kubernetes Services (AKS) to enable customers to operate efficiently and innovate faster. Microsoft initially designed the OS for internal use to develop and manage Azure services. What is Azure Linux?
Kubernetes (K8s) is the platform of choice for many organizations, providing a portable, extensible, open-source solution designed to streamline containerized workload oversight. According to InfoQ , Kubernetes monitoring offers substantial benefits for container management, but it’s not a complete platform in and of itself.
Although Dynatrace has its headquarters in Massachusetts and is publicly traded on the New York Stock Exchange ( NYSE:DT ), the epicenter of product design and creation is in Linz, Austria, where the company was founded in 2005. Key to this recognition as a uniquely global company is an agile and scalable approach to creativity. “You
In the recently published Gartner® “ Critic al Capabilities for Application Performance Monitoring and Observability,” Dynatrace scored highest for the IT Operations Use Case (4.15/5) This is accomplished by using service monitoring and anomaly detection for early-warning notifications of performance issues.” 5) in the Gartner report.
Real-time monitoring : The periodic reports from cloud service providers lack real-time monitoring and actionable insights, limiting IT teams’ ability to make immediate adjustments to reduce carbon footprints. Thermal design power (TDP) values are derived from AMD and Intel to calculate CPU power consumption.
How can we design systems that recognize these nuances and empower every title to shine and bring joy to ourmembers? Option 1: Log Processing Log processing offers a straightforward solution for monitoring and analyzing title launches. Yet, these pages couldnt be more different. How do we bridge this gap?
In the 2023 Magic Quadrant for Application Performance Monitoring (APM) and Observability, Gartner has named Dynatrace a Leader and positioned it highest for Ability to Execute and furthest for Completeness of Vision. Although implementations are nascent, the security capabilities of APM and observability tools have proved to be valuable.
We organize all of the trending information in your field so you don't have to. Join 5,000+ users and stay up to date on the latest articles your peers are reading.
You know about us, now we want to get to know you!
Let's personalize your content
Let's get even more personalized
We recognize your account from another site in our network, please click 'Send Email' below to continue with verifying your account and setting a password.


Let's personalize your content