This site uses cookies to improve your experience. To help us insure we adhere to various privacy regulations, please select your country/region of residence. If you do not select a country, we will assume you are from the United States. Select your Cookie Settings or view our Privacy Policy and Terms of Use.
Cookie Settings
Cookies and similar technologies are used on this website for proper function of the website, for tracking performance analytics and for marketing purposes. We and some of our third-party providers may use cookie data for various purposes. Please review the cookie settings below and choose your preference.
Used for the proper function of the website
Used for monitoring website traffic and interactions
Cookie Settings
Cookies and similar technologies are used on this website for proper function of the website, for tracking performance analytics and for marketing purposes. We and some of our third-party providers may use cookie data for various purposes. Please review the cookie settings below and choose your preference.
Strictly Necessary: Used for the proper function of the website
Performance/Analytics: Used for monitoring website traffic and interactions
Let’s explore some of the advantages of monitoring GitHub runners using Dynatrace. By integrating Dynatrace with GitHub Actions, you can proactively monitor for potential issues or slowdowns in the deployment processes. Inefficient or resource-intensive runners can lead to increased costs and underutilized infrastructure.
We’re excited to announce that Dynatrace has been named a Leader in the inaugural 2024 Gartner® Magic Quadrant™ for Digital Experience Monitoring. Dynatrace digital experience monitoring (DEM) monitors and analyzes the quality of digital experiences for users across digital channels by collecting data from multiple sources.
This year’s AWS re:Invent will showcase a suite of new AWS and Dynatrace integrations designed to enhance cloud performance, security, and automation. By automating OneAgent deployment at the image creation stage, organizations can immediately equip every EC2 instance with real-time monitoring and AI-powered analytics.
Infrastructure complexity is costing enterprises money. AIOps offers an alternative to traditional infrastructuremonitoring and management with end-to-end visibility and observability into IT stacks. As 69% of CIOs surveyed said, it’s time for a “radically different approach” to infrastructuremonitoring.
One of the promises of container orchestration platforms is to make i t easier for the developers to accelerate the deployment of their app lication s without having to worry about scalability and infrastructure dependencies. Monitoring in the Kubernetes world . L et’s look at some of the Day 2 operations use case s. .
An hourly rate for InfrastructureMonitoring The Dynatrace Platform Subscription (DPS) offers a flat rate for InfrastructureMonitoring , providing observability for cloud platforms, containers, networks, and data center technologies with no limits on host memory and with AIOps included.
With Dashboards , you can monitor business performance, user interactions, security vulnerabilities, IT infrastructure health, and so much more, all in real time. Follow along to create this host monitoring dashboard We will create a basic Host Monitoring dashboard in just a few minutes. Create a new dashboard.
Veeramachaneni discusses how OTel is standardizing telemetry data and inspiring new open-source data collectors and workflows that bridge the gap between application and infrastructuremonitoring. It’s given them flexibility and freedom that they didn’t have before.
This latest integration with Microsoft Sentinel expands our partnership, providing joint customers with a holistic view of their entire cloud environment; from application to infrastructure, data, and security. “As The solution also allows customers to combine alerts from best-in-class security solutions. Runtime application protection.
In addition to automatic full-stack monitoring, Dynatrace provides comprehensive support for all AWS services that publish metrics to Amazon CloudWatch, providing advanced observability for dynamic hybrid clouds. We’re therefore excited to announce that Dynatrace has received the AWS Outposts Service Ready designation.
.” While this methodology extends to every layer of the IT stack, infrastructure as code (IAC) is the most prominent example. Here, we’ll tackle the basics, benefits, and best practices of IAC, as well as choosing infrastructure-as-code tools for your organization. What is infrastructure as code? Consistency.
That’s where hyperconverged infrastructure, or HCI, comes in. What is hyperconverged infrastructure? Hyperconverged infrastructure (HCI) is an IT architecture that combines servers, storage, and networking functions into a unified, software-centric platform to streamline resource management. Realizing the benefits of HCI.
By: Rajiv Shringi , Oleksii Tkachuk , Kartik Sathyanarayanan Introduction In our previous blog post, we introduced Netflix’s TimeSeries Abstraction , a distributed service designed to store and query large volumes of temporal event data with low millisecond latencies. Today, we’re excited to present the Distributed Counter Abstraction.
Business events: Delivering the best data It’s been two years since we introduced business events , a special class of events designed to support even the most demanding business use cases. Business process monitoring and optimization. Want to see how we use business events from log files to support business process monitoring?
Now let’s look at how we designed the tracing infrastructure that powers Edgar. This insight led us to build Edgar: a distributed tracing infrastructure and user experience. Our distributed tracing infrastructure is grouped into three sections: tracer library instrumentation, stream processing, and storage.
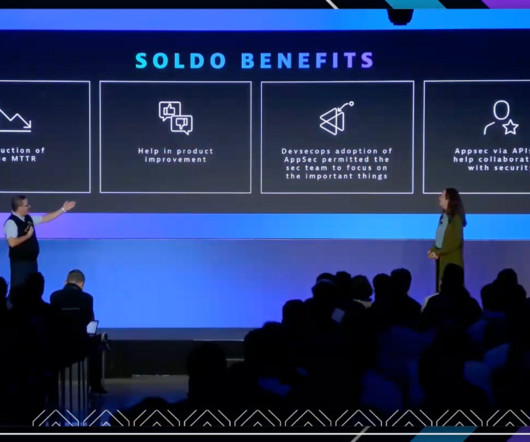
At financial services company, Soldo, efficiency and security by design are paramount goals. These practices include observability, application security, Kubernetes monitoring, and microservices migration. Because Soldo is in a highly regulated industry, Domenella’s team adopted security by design from the beginning.
This is partly due to the complexity of instrumenting and analyzing emissions across diverse cloud and on-premises infrastructures. Integration with existing systems and processes : Integration with existing IT infrastructure, observability solutions, and workflows often requires significant investment and customization.
RabbitMQ is designed for flexible routing and message reliability, while Kafka handles high-throughput event streaming and real-time data processing. RabbitMQ can be deployed in distributed environments and includes monitoring tools through a built-in dashboard and CLI.
IBM i is designed to integrate seamlessly with legacy and modern applications, allowing businesses to run critical workloads and applications. It’s all monitored remotely ! Get a health overview of each system Monitor your system’s performance and detect unexpected events such as IPLs, CPU spikes, and exceeded total job limits.
These resources generate vast amounts of data in various locations, including containers, which can be virtual and ephemeral, thus more difficult to monitor. These challenges make AWS observability a key practice for building and monitoring cloud-native applications. What is AWS observability? And why it matters. Amazon EC2.
In addition to automatic full-stack monitoring, Dynatrace provides comprehensive support for a wide range of AWS services. We’re therefore excited to announce that Dynatrace has received the Amazon RDS Service Ready designation. All-in-one, AI-powered monitoring of AWS applications and infrastructure.
This blog post explains how Dynatrace simplifies log ingestion, whether youre onboarding logs from your infrastructure using OneAgent, cloud services using log forwarding, or driving open-source standardization leveraging OpenTelemetry (OTel), Fluent Bit, or any other API-based ingestion methods. Configuration is fully customizable.
In today's rapidly evolving digital landscape, businesses increasingly rely on cloud computing and infrastructure to support their operations. As organizations migrate their workloads to the cloud, robust monitoring and management tools are paramount to ensure optimal performance, security, and efficiency.
Citrix is critical infrastructure For businesses operating in industries with strict regulations, such as healthcare, banking, or government, Citrix virtual apps and virtual desktops are essential for simplified infrastructure management, secure application delivery, and compliance requirements.
With the pace of digital transformation continuing to accelerate, organizations are realizing the growing imperative to have a robust application security monitoring process in place. What are the goals of continuous application security monitoring and why is it important?
Real user monitoring can help you catch these issues before they impact the bottom line. What is real user monitoring? Real user monitoring (RUM) is a performance monitoring process that collects detailed data about a user’s interaction with an application. Real user monitoring collects data on a variety of metrics.
Also, if limits are set too low, some critical components in your infrastructure might go unmonitored, potentially negatively impacting your business. While if limits are set too high, you might pay for more monitoring than you need and exceed your budget. This approach is time-consuming and requires ongoing management.
As more organizations transition to distributed services, IT teams are experiencing the limitations of traditional monitoring tools, which were designed for yesterday’s monolithic architectures. Where traditional monitoring falls flat. The architects and developers who create the software must design it to be observed.
Dynatrace is proud to provide deep monitoring support for Azure Linux as a container host operating system (OS) platform for Azure Kubernetes Services (AKS) to enable customers to operate efficiently and innovate faster. Microsoft initially designed the OS for internal use to develop and manage Azure services. What is Azure Linux?
Cloud integration and application performance monitoring at the federal level is in full force. Managing the mission with cloud monitoring. The EMCA recently implemented a new monitoring approval process, which breaks down details such as how a system functions, how information is being shared, and the overall software capabilities.
Kubernetes (K8s) is the platform of choice for many organizations, providing a portable, extensible, open-source solution designed to streamline containerized workload oversight. According to InfoQ , Kubernetes monitoring offers substantial benefits for container management, but it’s not a complete platform in and of itself.
IT, DevOps, and SRE teams are racing to keep up with the ever-expanding complexity of modern enterprise cloud ecosystems and the business demands they are designed to support. Observability is the new standard of visibility and monitoring for cloud-native architectures. Requirements to achieve multicloud observability and monitoring.
Digital experience monitoring (DEM) allows an organization to optimize customer experiences by taking into account the context surrounding digital experience metrics. What is digital experience monitoring? Primary digital experience monitoring tools.
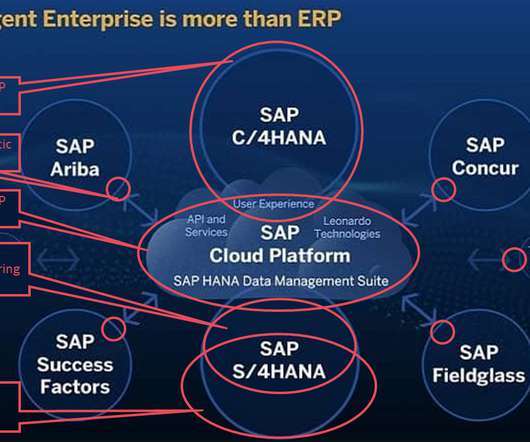
This means that you should ask the following: Does your monitoring solution work with SAP both on-premise and within cloud infrastructure ? Cover all your monitoring needs across your entire SAP product portfolio with Dynatrace. Monitor, analyze, and boost customer experience on SAP C/4HANA and SAP Cloud Platform.
If we think back to just a few years ago when most application workloads were primarily monolithic and deployed on-premise, it was fairly simple to gain observability by collecting some logs, metrics and traces, since all the infrastructure was self-owned and the scale was manageable.
In these modern environments, every hardware, software, and cloud infrastructure component and every container, open-source tool, and microservice generates records of every activity. What is the difference between monitoring and observability? Is observability really monitoring by another name? In short, no.
How can we design systems that recognize these nuances and empower every title to shine and bring joy to ourmembers? Option 1: Log Processing Log processing offers a straightforward solution for monitoring and analyzing title launches. Yet, these pages couldnt be more different. How do we bridge this gap?
Gartner’s Top Emerging Trends in Cloud Native Infrastructure Report states, “Containers and Kubernetes are becoming the foundation for building cloud-native infrastructure to improve software velocity and developer productivity”. Don’t underestimate complexity. Kubernetes is not monolithic. Stand-alone observability won’t cut it.
Observability and monitoring as a source of truth. To provide actionable answers monitoring systems store, baseline, and analyze telemetry data. But there are other related components and processes (for example, cloud provider infrastructure) that can cause problems in applications running on Kubernetes.
Dynatrace with Red Hat OpenShift monitoring stands out for the following reasons: With infrastructure health monitoring and optimization, you can assess the status of your infrastructure at a glance to understand resource consumption and thus optimize resource allocation for cost efficiency.
Open-Sourcing a Monitoring GUI for Metaflow, Netflix’s ML Platform tl;dr Today, we are open-sourcing a long-awaited GUI for Metaflow. The Metaflow GUI allows data scientists to monitor their workflows in real-time, track experiments, and see detailed logs and results for every executed task.
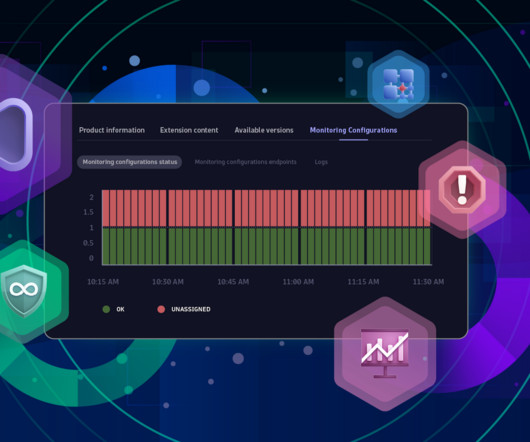
Introducing Dynatrace Extensions In short, the Extensions app is the central place for configuring, monitoring, and discovering extensions. You can call upon it to fill any monitoring gaps. You usually know precisely what you need regarding monitoring and which technologies and services you want to monitor.
In the 2023 Magic Quadrant for Application Performance Monitoring (APM) and Observability, Gartner has named Dynatrace a Leader and positioned it highest for Ability to Execute and furthest for Completeness of Vision. Although implementations are nascent, the security capabilities of APM and observability tools have proved to be valuable.
The development of internal platform teams has taken off in the last three years, primarily in response to the challenges inherent in scaling modern, containerized IT infrastructures. The ability to effectively manage multi-cluster infrastructure is critical to consistent and scalable service delivery.
We organize all of the trending information in your field so you don't have to. Join 5,000+ users and stay up to date on the latest articles your peers are reading.
You know about us, now we want to get to know you!
Let's personalize your content
Let's get even more personalized
We recognize your account from another site in our network, please click 'Send Email' below to continue with verifying your account and setting a password.


Let's personalize your content