This site uses cookies to improve your experience. To help us insure we adhere to various privacy regulations, please select your country/region of residence. If you do not select a country, we will assume you are from the United States. Select your Cookie Settings or view our Privacy Policy and Terms of Use.
Cookie Settings
Cookies and similar technologies are used on this website for proper function of the website, for tracking performance analytics and for marketing purposes. We and some of our third-party providers may use cookie data for various purposes. Please review the cookie settings below and choose your preference.
Used for the proper function of the website
Used for monitoring website traffic and interactions
Cookie Settings
Cookies and similar technologies are used on this website for proper function of the website, for tracking performance analytics and for marketing purposes. We and some of our third-party providers may use cookie data for various purposes. Please review the cookie settings below and choose your preference.
Strictly Necessary: Used for the proper function of the website
Performance/Analytics: Used for monitoring website traffic and interactions
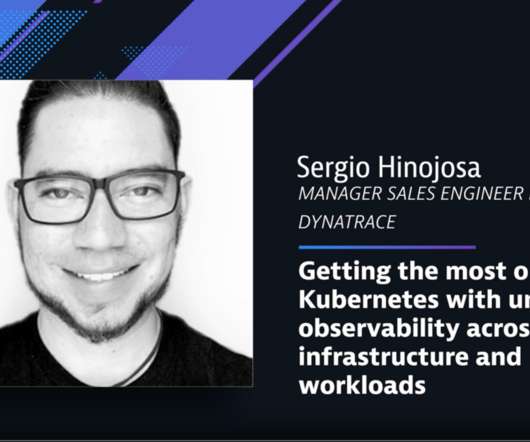
As more organizations embrace DevOps and CI/CD pipelines, GitHub-hosted runners and GitHub Actions have emerged as powerful tools for automating workflows. Let’s explore some of the advantages of monitoring GitHub runners using Dynatrace. Extending this visibility into your CI/CD pipelines offers even greater value.
Manual approaches lack continuous monitoring, making them ill-equipped to prevent issues before they arise. The time has come to move beyond outdated practices and adopt solutions designed for the realities of Kubernetes environments. This empowers teams to efficiently deliver secure, compliant Kubernetes applications by design.
Metis has built an AI-driven database observability platform designed for developers and SREs. With Metis, were making database troubleshooting as seamless as any other part of the DevOps workflow. For SREs, this means better proactive monitoring, fewer database-related incidents, and greater stability in production environments.
As more organizations transition to distributed services, IT teams are experiencing the limitations of traditional monitoring tools, which were designed for yesterday’s monolithic architectures. Where traditional monitoring falls flat. The architects and developers who create the software must design it to be observed.
DevOps automation can help to drive reliability across the SDLC and accelerate time-to-market for software applications and new releases. What is DevOps automation? DevOps automation is a set of tools and technologies that perform routine, repeatable tasks that engineers would otherwise do manually.
DevOps seeks to accomplish smooth and efficient software creation, delivery, monitoring, and improvement by prioritizing agility and adaptability over rigid, stage-by-stage development. What is DevOps? As DevOps pioneer Patrick Debois first described it in 2009, DevOps is not a specific technology, but a tactical approach.
You have set up a DevOps practice. As we look at today’s applications, microservices, and DevOps teams, we see leaders are tasked with supporting complex distributed applications using new technologies spread across systems in multiple locations. DevOps metrics to help you meet your DevOps goals. Dynatrace news.
As organizations accelerate innovation to keep pace with digital transformation, DevOps observability is becoming a critical key to success for DevOps and DevSecOps teams. DevOps and DevSecOps practices help organizations release software faster and more frequently, paving the way for digital transformation.
They offer a comprehensive end-to-end solution to these challenges, providing functionalities designed to enhance compliance and resilience in IT environments. It gives you visibility into which components are monitored and which are not and helps automate time-consuming compliance configuration checks.
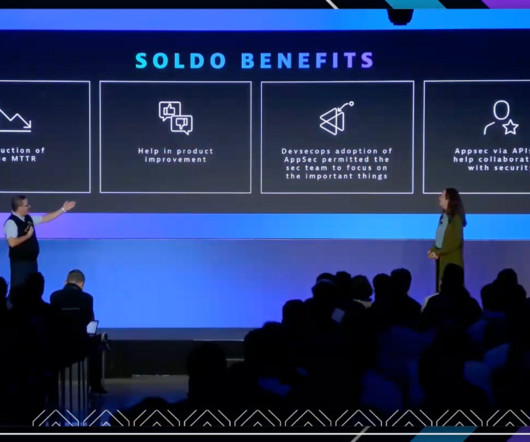
At financial services company, Soldo, efficiency and security by design are paramount goals. We believe at Soldo that efficiency is the key value to be very successful in the business we run,” said Luca Domenella, head of cloud operations and DevOps at Soldo. What is security by design?
As cloud-native, distributed architectures proliferate, the need for DevOps technologies and DevOps platform engineers has increased as well. DevOps engineer tools can help ease the pressure as environment complexity grows. ” What does a DevOps platform engineer do? A DevOps platform engineer is a more recent term.
The DevOps approach to developing software aims to speed applications into production by releasing small builds frequently as code evolves. As part of the continuous cycle of progressive delivery, DevOps teams are also adopting shift-left and shift-right principles to ensure software quality in these dynamic environments.
The DevOps approach to developing software aims to speed applications into production by releasing small builds frequently as code evolves. As part of the continuous cycle of progressive delivery, DevOps teams are also adopting shift-left and shift-right principles to ensure software quality in these dynamic environments.
So how do development and operations (DevOps) teams and site reliability engineers (SREs) distinguish among good, great, and suboptimal SLOs? The state of service-level objectives While SLOs play a critical role in helping DevOps and SRE teams align technical objectives with business goals, they’re not always easy to define.
That’s especially true of the DevOps teams who must drive digital-fueled sustainable growth. All of these factors challenge DevOps maturity. Data scale and silos present challenges to DevOps maturity DevOps teams often run into problems trying to drive better data-driven decisions with observability and security data.
IT, DevOps, and SRE teams are racing to keep up with the ever-expanding complexity of modern enterprise cloud ecosystems and the business demands they are designed to support. Observability is the new standard of visibility and monitoring for cloud-native architectures. Dynatrace news.
AIOps offers an alternative to traditional infrastructure monitoring and management with end-to-end visibility and observability into IT stacks. But increasing complexity and lacking visibility creates a problem: Enterprises invest more resources into monitoring and don’t get the data and answers they need.
Creating an ecosystem that facilitates data security and data privacy by design can be difficult, but it’s critical to securing information. When organizations focus on data privacy by design, they build security considerations into cloud systems upfront rather than as a bolt-on consideration.
DevSecOps is a cross-team collaboration framework that integrates security into DevOps processes from the start rather than waiting to address security in a separate silo. How is it different from DevOps, and what’s next for the relationship between development, security, and operations within enterprises? Development.
More specifically, I’ll demonstrate how in just a few steps, you can add Dynatrace information events to your Azure DevOps release pipelines for things like deployments, performance tests, or configuration changes. Microsoft DevOps Azure is one of the best CI/CD systems and a strategic technical Dynatrace partner.
In the 2023 Magic Quadrant for Application Performance Monitoring (APM) and Observability, Gartner has named Dynatrace a Leader and positioned it highest for Ability to Execute and furthest for Completeness of Vision. 5), DevOps/AppDev (4.08/5), 5), SRE (Site Reliability Engineering)/Platform Operations (4.08/5), 5) Use Cases.
A DevSecOps approach advances the maturity of DevOps practices by incorporating security considerations into every stage of the process, from development to deployment. DevSecOps best practices provide guidelines to help organizations achieve efficient and secure application design, development, implementation, and management.
Centralization of platform capabilities improves efficiency of managing complex, multi-cluster infrastructure environments According to research findings from the 2023 State of DevOps Report , “36% of organizations believe that their team would perform better if it was more centralized.” All important health signals are highlighted.
As developers move to microservice-centric designs, components are broken into independent services to be developed, deployed, and maintained separately. IDC predicted, by 2022, 90% of all applications will feature microservices architectures that improve the ability to design, debug, update, and use third-party code. Hard on DevOps.
I am delighted to share, Dynatrace has been named a Leader for the 11 th consecutive time in the 2021 Gartner Magic Quadrant for Application Performance Monitoring (APM) report. We anticipated the industry’s move to dynamic multicloud environments and DevOps processes.
Teams can no longer effectively manage and secure today’s multicloud environments using traditional monitoring tools. While conventional monitoring scans the environment using correlation and statistics, it provides little contextual information for remediating performance or security issues. Modern observability vs. monitoring.
Kubernetes (K8s) is the platform of choice for many organizations, providing a portable, extensible, open-source solution designed to streamline containerized workload oversight. According to InfoQ , Kubernetes monitoring offers substantial benefits for container management, but it’s not a complete platform in and of itself.
As a result, IT operations, DevOps , and SRE teams are all looking for greater observability into these increasingly diverse and complex computing environments. What is the difference between monitoring and observability? Is observability really monitoring by another name? But what is observability? In short, no.
Gartner just released its latest Magic Quadrant for Application Performance Monitoring (APM) , and a separate Critical Capabilities for APM report. Gartner, Magic Quadrant for Application Performance Monitoring, Charley Rich, Federico De Silva, 22 April 2020. Dynatrace news. Before 2015, Dynatrace was listed as Compuware.
this is addressed through monitoring and redundancy. Monitor the servers on various parameters and build redundancy. There are various High availability deployment patterns that are employed and with the advent of containerization bundled with the power of DevOps, more efficient patterns of solving this problem have also emerged.
To combat these challenges, organizations need an IT culture that addresses security resilience from the outset—also known as security by design —which, in turn, supports business resilience. In recent years, the number of vulnerabilities has overtaken the ability to effectively monitor IT environments manually.
We’ve worked closely with our partner AWS to deliver a complete, end-to-end picture of your cloud environment that includes monitoring support for all AWS services. Dynatrace can monitor AWS Lambda functions automatically, just like any other service. With these steps complete, your Lambda functions are now fully monitored.
As a result, many organizations have turned to DevOps (the alignment of development and operations teams) and DevSecOps (the alignment of development, security and operations teams) methodologies to enable more efficient and high-quality software development. Teams can also identify issues for users through digital experience monitoring.
For Federal, State and Local agencies to take full advantage of the agility and responsiveness of a DevOps approach to the software lifecycle, Security must also play an integral role across lifecycle stages. Modern DevOps permits high velocity development cycles resulting in weekly, daily, or even hourly software releases.
ITOps refers to the process of acquiring, designing, deploying, configuring, and maintaining equipment and services that support an organization’s desired business outcomes. Computer operations manages the physical location of the servers — cooling, electricity, and backups — and monitors and responds to alerts. Functionality.
The need for automation and orchestration across the software development lifecycle (SDLC) has increased, but many DevOps and SRE (site reliability engineering) teams struggle to unify disparate tools and cut back on manual tasks. Now, Security, DevOps, and SRE teams can automate their delivery pipeline. Atlassian Bitbucket.
The impact of limited visibility in CI/CD pipelines The journey for Omnilogy started when a customer explained that they needed a way to monitor and improve the performance of their CI/CD pipelines with Dynatrace. Normalization of data on ingest.
IAC uses descriptive code that, in many ways, mimics the DevOps approach to source code. IAC automates infrastructure configuration and tasks, such as resource management and monitoring, to streamline IT operations, create consistency, and provide visibility. Address monitoring at scale. How does IAC work?
When it comes to mobile monitoring, everyone has their own point of view… Mobile is not a single technology: it involves different development teams handling Android and iOS apps, performance engineering teams, cloud operations, and marketing. How do I connect the dots between mobile analytics and performance monitoring?
Data observability involves monitoring and managing the internal state of data systems to gain insight into the data pipeline, understand how data evolves, and identify any issues that could compromise data integrity or reliability. This not only underscores the universal significance of data, it also hints at its pivotal role within DevOps.
Flow Designer for more consistency in the delivery cycle. At this year’s Google Cloud Next conference, xMatters introduced Flow Designer , a visual designer that enables users to resolve issues without writing a single line of code. Flow Designer then connects the tools for you. How is this done? Slow microservices.
A microservices approach enables DevOps teams to develop an application as a suite of small services. While microservices vs. monolithic architecture is a common debate, organizations have other considerations, like service-oriented architecture (SOA), tools, monitoring solutions, and potential migration issues.
But OpenShift provides comprehensive multi-tenancy features, advanced security and monitoring, integrated storage, and CI/CD pipeline management right out of the box. OpenShift, DevOps, and CI/CD. By taking better control of their Kubernetes environments, OpenShift can help organizations reach their full DevOps potential.
We organize all of the trending information in your field so you don't have to. Join 5,000+ users and stay up to date on the latest articles your peers are reading.
You know about us, now we want to get to know you!
Let's personalize your content
Let's get even more personalized
We recognize your account from another site in our network, please click 'Send Email' below to continue with verifying your account and setting a password.


Let's personalize your content