This site uses cookies to improve your experience. To help us insure we adhere to various privacy regulations, please select your country/region of residence. If you do not select a country, we will assume you are from the United States. Select your Cookie Settings or view our Privacy Policy and Terms of Use.
Cookie Settings
Cookies and similar technologies are used on this website for proper function of the website, for tracking performance analytics and for marketing purposes. We and some of our third-party providers may use cookie data for various purposes. Please review the cookie settings below and choose your preference.
Used for the proper function of the website
Used for monitoring website traffic and interactions
Cookie Settings
Cookies and similar technologies are used on this website for proper function of the website, for tracking performance analytics and for marketing purposes. We and some of our third-party providers may use cookie data for various purposes. Please review the cookie settings below and choose your preference.
Strictly Necessary: Used for the proper function of the website
Performance/Analytics: Used for monitoring website traffic and interactions
OpenTelemetry Astronomy Shop is a demo application created by the OpenTelemetry community to showcase the features and capabilities of the popular open-source OpenTelemetry observability standard. OpenTelemetry provides a common set of tools, APIs, and SDKs to help collect observability signals from applications and infrastructure endpoints.
The demo has been in active development since the summer of 2022 with Dynatrace as one of its leading contributors. The demo application is a cloud-native e-commerce application made up of multiple microservices. OpenTelemetry demo application architecture diagram. By default, the demo comes with?Jaeger OpenTelemetry?community
One of the promises of container orchestration platforms is to make i t easier for the developers to accelerate the deployment of their app lication s without having to worry about scalability and infrastructure dependencies. It is important to understand the impact infrastructure can have on the platform and the application it runs.
We also introduced our demo app and explained how to define the metrics and traces it uses. The second part, The road to observability with OpenTelemetry part 2: Setting up OpenTelemetry and instrumenting applications , covers the details of how to set up OpenTelemetry in our demo application and how to instrument the services.
You can easily pivot between a hot Kubernetes cluster and the log file related to the issue in 2-3 clicks in these Dynatrace® Apps: Infrastructure & Observability (I&O), Databases, Clouds, and Kubernetes. Finding answers begins with opening the right app for your use case. A sudden drop in received log data?
This includes troubleshooting issues with software, services, and applications, and any infrastructure they interact with, such as multicloud platforms, container environments, and data repositories. Log analytics also help identify ways to make infrastructure environments more predictable, efficient, and resilient.
Be sure to fine-tune the anomaly detection settings for your mobile app so that you can focus on those anomalies that are most relevant to the experience of your end users. Test Flutter monitoring with our demo app. To get you up to speed quickly and to test Dynatrace easily, we provide a small Flutter demo app.
Cloud-hosted managed services eliminate the minute day-to-day tasks associated with hosting IT infrastructure on-premises. It captures their metrics, logs, traces, and user experience data, and analyzes them in the context of their dependencies among other services and infrastructure. Making use of serverless architecture.
Someone hacks together a quick demo with ChatGPT and LlamaIndex. The system is inconsistent, slow, hallucinatingand that amazing demo starts collecting digital dust. Check out the graph belowsee how excitement for traditional software builds steadily while GenAI starts with a flashy demo and then hits a wall of challenges?
Gartner estimates that by 2025, 70% of digital business initiatives will require infrastructure and operations (I&O) leaders to include digital experience metrics in their business reporting. With DEM solutions, organizations can operate over on-premise network infrastructure or private or public cloud SaaS or IaaS offerings.
This challenge has given rise to the discipline of observability engineering, which concentrates on the details of telemetry data to fine-tune observability use cases. This covers the infrastructure, processes, and the application stack, including tracing, profiling, and logs. Please stay tuned!
Gartner’s Top Emerging Trends in Cloud Native Infrastructure Report states, “Containers and Kubernetes are becoming the foundation for building cloud-native infrastructure to improve software velocity and developer productivity”. Click here to sign up for a Free 15-day trial , or contact us directly for a demo.
I f you ’re already a Dynatrace customer all you have to do to enable Dynatrace Application Security is flip one switch in your environment – regardless of whether you have full-stack or an infrastructure-only deployment. For more information visit our web page and watch the demo. Stay tuned – this is only the start.
Even with cloud-based foundation models like GPT-4, which eliminate the need to develop your own model or provide your own infrastructure, fine-tuning a model for any particular use case is still a major undertaking. of users) report that “infrastructure issues” are an issue. We’ll say more about this later.) Which Model?
Gartner’s Top Emerging Trends in Cloud Native Infrastructure Report states, “Containers and Kubernetes are becoming the foundation for building cloud-native infrastructure to improve software velocity and developer productivity”. Click here to sign up for a Free 15-day trial , or contact us directly for a demo.
The goal of DynamoDB is simple: to provide the same level of scalability and availability as the original Dynamo, while freeing developers from the burden of operating distributed datastores (such as cluster setup, software upgrades, hardware lifecycle management, performance tuning, security upgrades, operations, etc.)
FSD has a sense of purpose, a planning capability, has real time agency and responds to its environment via an ego model, predicting the behavior of pedestrians and other road users, and is being tuned to drive in a very human way, so that other road users interact with it as a predicable normal driver. Tristan Zajonc, CEO of Continual.ai
SUS101: Sustainability innovation in AWS Global Infrastructure AWS is determined to make the cloud the cleanest and most energy-efficient way to run customers’ infrastructure and business. Through customer examples and a demo, learn how you can build a sustainability showback mechanism for your application teams and drive change.
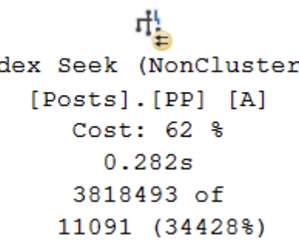
This can make it difficult to draw sound performance-tuning conclusions. For more details on the profiling data collected using different capture methods, see the product documentation covering the Query Profiling Infrastructure. CQScanProfileNew. Like all row mode iterators, it has Open , GetRow , and Close methods, among others.
Check out the demo version of PHPDocumentor 2 to see the selection of new and improved PHP templates. Aside from infrastructure monitoring, New Relic can collect user data and provide valuable analysis to assist you in creating a better user experience. You can integrate cross referencing and tutorials by linking between documentation.
In this year's CFP we’re looking for topics covering the latest trends and best practices in cloud computing, containerization, machine learning, big data, infrastructure, scalability, DevOps, IT management, automation, reliability, monitoring, performance tuning, security, databases, programming, datacenters, and more.
In this year's CFP we’re looking for topics covering the latest trends and best practices in cloud computing, containerization, machine learning, big data, infrastructure, scalability, DevOps, IT management, automation, reliability, monitoring, performance tuning, security, databases, programming, datacenters, and more.
To summarize: Focusing on ASYNC_NETWORK_IO waits alone as a tuning metric is a mistake. Since I use SQLCMD a lot for demos while presenting, I created a testscript.sql file with the following contents: PRINT 'Minimize Screen' ; GO. Also see Greg's recent post about focusing on waits alone in general.). . <WaitStats FILLER , t2.
We organize all of the trending information in your field so you don't have to. Join 5,000+ users and stay up to date on the latest articles your peers are reading.
You know about us, now we want to get to know you!
Let's personalize your content
Let's get even more personalized
We recognize your account from another site in our network, please click 'Send Email' below to continue with verifying your account and setting a password.


Let's personalize your content