This site uses cookies to improve your experience. To help us insure we adhere to various privacy regulations, please select your country/region of residence. If you do not select a country, we will assume you are from the United States. Select your Cookie Settings or view our Privacy Policy and Terms of Use.
Cookie Settings
Cookies and similar technologies are used on this website for proper function of the website, for tracking performance analytics and for marketing purposes. We and some of our third-party providers may use cookie data for various purposes. Please review the cookie settings below and choose your preference.
Used for the proper function of the website
Used for monitoring website traffic and interactions
Cookie Settings
Cookies and similar technologies are used on this website for proper function of the website, for tracking performance analytics and for marketing purposes. We and some of our third-party providers may use cookie data for various purposes. Please review the cookie settings below and choose your preference.
Strictly Necessary: Used for the proper function of the website
Performance/Analytics: Used for monitoring website traffic and interactions
In this OpenTelemetry demo series, we’ll take an in-depth look at how to use OpenTelemetry to add observability to a distributed web application that originally didn’t know anything about tracing, telemetry, or observability. Observability may seem a fancy term, and it certainly does come with a fair share of complexity.
We also introduced our demo app and explained how to define the metrics and traces it uses. The second part, The road to observability with OpenTelemetry part 2: Setting up OpenTelemetry and instrumenting applications , covers the details of how to set up OpenTelemetry in our demo application and how to instrument the services.
Because of its matrix of cloud services across multiple environments, AWS and other multicloud environments can be more difficult to manage and monitor compared with traditional on-premises infrastructure. EC2 is Amazon’s Infrastructure-as-a-service (IaaS) compute platform designed to handle any workload at scale. Watch demo now!
VPC Flow Logs is an Amazon service that enables IT pros to capture information about the IP traffic that traverses network interfaces in a virtual private cloud, or VPC. By default, each record captures a network internet protocol (IP), a destination, and the source of the traffic flow that occurs within your environment.
In the following sections, we demo the following: Introduce Unguard, our insecure cloud-native microservices demo application. First, Dynatrace OneAgent will automatically monitor and trace our infrastructure and communicate with Dynatrace. To keep it real, we have a load generator that creates benign traffic.
VPC Flow Logs is a feature that gives you the capability to capture more robust IP traffic data that traverses your VPCs. Dynatrace uses your data and its sophisticated AI causation engine Davis® to automatically detect performance anomalies in applications, services, and infrastructure. What is VPC Flow Logs.
The key information displayed on the standard Dynatrace Problems app and the Infrastructure and Operations App became the basis of their team’s remediation plan. Examples include successful checkouts, newsletter signups, or demo requests. Dynatrace automatically found the hosts that were unavailable or having problems.
Synthetic CI/CD testing simulates traffic to add an outside-in view to the analysis. This 360-degree visibility into user journeys and the underlying applications or infrastructure are key insights provided only by Dynatrace. Dynatrace is happy to provide you with a demo or proof of concept for Cloud Automation.
Most infrastructure and applications generate logs. When it comes to security, logs can capture attack indicators, such as anomalous network traffic or unusual application activity outside of expected times. For more information on the use of logs and how Dynatrace increases observability, check out our power demo.
Gartner estimates that by 2025, 70% of digital business initiatives will require infrastructure and operations (I&O) leaders to include digital experience metrics in their business reporting. With DEM solutions, organizations can operate over on-premise network infrastructure or private or public cloud SaaS or IaaS offerings.
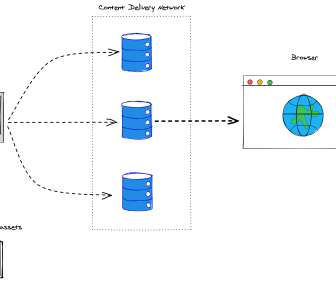
Introducing gnmi-gateway: a modular, distributed, and highly available service for modern network telemetry via OpenConfig and gNMI By: Colin McIntosh, Michael Costello Netflix runs its own content delivery network, Open Connect , which delivers all streaming traffic to our members.
Join Etleap , an Amazon Redshift ETL tool to learn the latest trends in designing a modern analytics infrastructure. Watch a demo and learn how Etleap can save you on engineering hours and decrease your time to value for your Amazon Redshift analytics projects. With your help we'd like to ad a few zeros to that number.
Join Etleap , an Amazon Redshift ETL tool to learn the latest trends in designing a modern analytics infrastructure. Watch a demo and learn how Etleap can save you on engineering hours and decrease your time to value for your Amazon Redshift analytics projects. With your help we'd like to ad a few zeros to that number.
Dynatrace knows critical details about the application in addition to the CVSS of a vulnerability; its real-user sessions, if it’s connected to a database, if it’s reachable from the public internet, if it has heavy or low traffic, and which other services it’s talking to. For more information visit our web page and watch the demo.
Join Etleap , an Amazon Redshift ETL tool to learn the latest trends in designing a modern analytics infrastructure. Watch a demo and learn how Etleap can save you on engineering hours and decrease your time to value for your Amazon Redshift analytics projects. With your help we'd like to ad a few zeros to that number.
Netlify’s new deployment infrastructure allows developers to create logic to determine what pieces of their app will build on deployment and what pieces will be deferred (and how they will be deferred). As mentioned above, the previous demo is actually a Proof-of-Concept , nothing is really good or bad if we cannot measure. Build time.
That’s not all, the global mobile traffic is expected to increase sevenfold between 2017 and 2022. Rather than running the tests on a less scalable & high-maintenance in-house infrastructure, automation tests can be performed on Testsigma’s scalable, secure, and low maintenance cloud. Book a demo.
There is no way to model how much more traffic you can send to that system before it exceeds it’s SLA. For this demo on an old MacBook (2.7 For high traffic systems, processing the individual response times for each request may be too much work. The initial loglik value is higher but trends to the same result.
It includes a demo of AWS Twinmaker and a discussion of lithium battery production and recycling by Northvolt in Sweden, who are using serverless on AWS to build factories-as-code. Talk by the team that is actually working on reducing the carbon footprint of AWS. SUS304 to SUS311 No talks with these codes.
It is also one of the four golden signals of monitoring, which also includes traffic, error, and saturation. The slow shift from monolithic systems to distributed systems has changed the way organizations and teams think about monitoring their infrastructure, websites, applications, APIs, etc. Monitoring a Distributed System.
You should expect one-time implementation cost (depending CMS and business requirements it can cost 200,000 USD to 3M USD) and yearly hosting infrastructure cost (proportional to load and traffic but typically 30,000 USD - 300,000 USD per year). Pure CMS licensing cost can be anywhere between 50,000 - 500,000 USD a year.
You can monitor, tweak, and retry traffic from any application or network device, with no need to write your own code. As you strive for full observability across your infrastructure, Apica Ascent delivers insights that ensure your end users have the best experience possible. Click here to schedule a demo/conversation.
Pinterest serves over 200 million global monthly active users and an infrastructure that serves over 1 millions request per second. For unauthorized pages, the same migration saw a 30% improvement in performance and a 15% increase in signups, 10% increase in SEO traffic and a 5-7% increase in logins.
Additionally, DebugBar can monitor network traffic, inspect CSS elements and evaluate your JavaScript code. Check out the demo version of PHPDocumentor 2 to see the selection of new and improved PHP templates. DebugBar DebugBar is a useful tool for any developer since it can catch HTML and JavaScript bugs as well.
example.net --port=27017 --username=user --authenticationDatabase=admin --db=demo --collection=events --out=/opt/backup/mongodump-2011-10-24 Note : If we don’t specify the DB name or Collection name explicitly in the above “mongodump” syntax then the backup will be taken for the entire database or collections, respectively.
CrUX generates an overview of performance distributions over time, with traffic collected from Google Chrome users. But account for the different types and usage behaviors of your customers (which Tobias Baldauf called cadence and cohorts ), along with bot traffic and seasonality effects. You can create your own on Chrome UX Dashboard.
For Mac OS, we can use Network Link Conditioner , for Windows Windows Traffic Shaper , for Linux netem , and for FreeBSD dummynet. Incremental Transfer Demo is already available, and it’s work in progress. Lighthouse , a performance auditing tool integrated into DevTools. Large preview ). Build Optimizations.
We organize all of the trending information in your field so you don't have to. Join 5,000+ users and stay up to date on the latest articles your peers are reading.
You know about us, now we want to get to know you!
Let's personalize your content
Let's get even more personalized
We recognize your account from another site in our network, please click 'Send Email' below to continue with verifying your account and setting a password.


Let's personalize your content