This site uses cookies to improve your experience. To help us insure we adhere to various privacy regulations, please select your country/region of residence. If you do not select a country, we will assume you are from the United States. Select your Cookie Settings or view our Privacy Policy and Terms of Use.
Cookie Settings
Cookies and similar technologies are used on this website for proper function of the website, for tracking performance analytics and for marketing purposes. We and some of our third-party providers may use cookie data for various purposes. Please review the cookie settings below and choose your preference.
Used for the proper function of the website
Used for monitoring website traffic and interactions
Cookie Settings
Cookies and similar technologies are used on this website for proper function of the website, for tracking performance analytics and for marketing purposes. We and some of our third-party providers may use cookie data for various purposes. Please review the cookie settings below and choose your preference.
Strictly Necessary: Used for the proper function of the website
Performance/Analytics: Used for monitoring website traffic and interactions
If you’re a developer who has ever had to troubleshoot a database issue, you know how frustrating it can be. And with cloud-native databases like PostgreSQL and MySQL, the complexity only grows. Metis has built an AI-driven database observability platform designed for developers and SREs.
Ensuring database reliability can be difficult. We want developers to be able to work efficiently while taking ownership of their databases. Achieving this becomes much simpler when robust database observability is in place. Our goal is to speed up development and minimize rollbacks. Lets explore how.
When deployed on bare-metal clusters or cloud VMs, database administrators are responsible for adding and removing nodes in a clustered system, planning the changes at times of low load to minimize disruption to production workloads.
Top takeaways: Key OpenTelemetry trends in 2025 Semantic Conventions ensure alignment: Semantic Conventions provide consistent telemetry data interpretation, correlation, and automation, with HTTP spans now stable and other domains like databases and messaging nearing stabilization. OpenTelemetry Collector 1.0
If you’re running SAP, you’re likely already familiar with the HANA relational database management system. However, if you’re an operations engineer who’s been tasked with migrating to HANA from a legacy database system, you’ll need to get up to speed quickly. Avoid false positives with auto-adaptive baselining.
If you’re hosting your databases in the cloud, choosing the right cloud service provider is a significant decision to make for your long-term hosting costs. Over the last few weeks, we have been inundated with requests from SMB customers looking to improve the ROI on their database hosting. MongoDB® Database. EC2 instances.
Maintaining optimal application performance is crucial for businesses, and fast databases are vital in achieving this goal. For an effective approach to database performance, it’s crucial to have a comprehensive overview of all databases, including server-side DBs.
Running Databases efficiently is crucial for business success Monitoringdatabases is essential in large IT environments to prevent potential issues from becoming major problems that result in data loss or downtime. However, horizontal scaling of these databases can take time and effort.
In part 2, we’ll show you how to retrieve business data from a database, analyze that data using dashboards and ad hoc queries, and then use a Davis analyzer to predict metric behavior and detect behavioral anomalies. Dynatrace users typically use extensions to pull technical monitoring data, such as device metrics, into Dynatrace.
While applications are built using a variety of technologies and frameworks, there is one thing they usually have in common: the data they work with must be stored in databases. Now, Dynatrace has gone a step further and expanded its coverage and intelligent observability into the next layer: database infrastructure.
Monitor and profile your Spring Boot application! You may also like: Monitoring Using Spring Boot 2.0, Monitoring is very essential for modern applications, modern applications are highly distributed in nature and have different dependencies like database, service, caching and many more.
In fact, according to a Dynatrace global survey of 1,300 CIOs , 99% of enterprises utilize a multicloud environment and seven cloud monitoring solutions on average. What is cloud monitoring? Cloud monitoring is a set of solutions and practices used to observe, measure, analyze, and manage the health of cloud-based IT infrastructure.
This trend is prompting advances in both observability and monitoring. But exactly what are the differences between observability vs. monitoring? Monitoring and observability provide a two-pronged approach. To get a better understanding of observability vs monitoring, we’ll explore the differences between the two.
Previously, our application was using one database; developers knew how it worked, and the deployment rarely happened. A single database administrator was capable of maintaining the database, optimizing the queries, and making sure things worked as expected. Cloud and microservices changed the world.
From retrieving logs in vector databases to generating final responses with large language models, every interaction must be visible and auditable to scale confidently in production. To address these needs, our enhanced RAG pipeline integrates Literal AI for end-to-end tracing of both retrieval and generation steps.
Digital experience monitoring (DEM) is crucial for organizations to meet this demand and succeed in today’s competitive digital economy. DEM solutions monitor and analyze the quality of digital experiences for users across digital channels. The time taken to complete the page load.
It's challenging to troubleshoot issues in a distributed database because the information about the system is scattered in different machines. TiDB is an open-source, distributed SQL database that supports Hybrid Transactional/Analytical Processing (HTAP) workloads. Before version 4.0, Before version 4.0,
A graphical user interface (GUI) helps simplify how you interact with your MySQL databases. Whether youre a developer, database administrator, or data analyst, a good GUI can make everyday tasks faster, clearer, and less error-prone. Thats where MySQL GUIs come in.
As cloud applications have become the norm, the databases that power these applications are now typically run as managed services by cloud providers. When you use Dynatrace Log Monitoring, it’s enough to forward your logs and have Dynatrace take care of the rest. Optimize database performance.
At Percona, we’re committed to providing you with the best databasemonitoring and management tools. With the release of Percona Monitoring and Management 3 (PMM 3), we’re now entering a critical phase in the lifecycle of PMM 2.
With the pace of digital transformation continuing to accelerate, organizations are realizing the growing imperative to have a robust application security monitoring process in place. What are the goals of continuous application security monitoring and why is it important?
It also includes various built-in software components for database management, security, and application development. It then collects performance data using existing database services running on your system. It’s all monitored remotely ! Gaining knowledge about IBM i performance can be a challenging and pricey task.
October 14, 2020 – ScaleGrid, a leading Database-as-a-Service (DBaaS) provider, has just announced the launch of Google Cloud Platform (GCP) hosting through their fully managed DBaaS plans. Google Cloud Platform is the second most popular cloud provider for open source database hosting according to the 2019 Open Source Database Report.
There are also many cases where business data—transactional, inventory, or financial—is at rest or in use , stored in a database. Dynatrace extensions can easily query data from various databases and store the results in Grail™, the Dynatrace data lakehouse. This can be accomplished using Dynatrace extensions.
Database calls. Maybe there are external HTTP Calls in several different places, or dozens of different views with their own database calls. If we added support to automatically instrument these libraries without lengthy code change, we can help save developers many hours and make the monitoring experience easier. Custom code.
The Service Level Monitoring section contains the following charts: Top Spans: An overview of the most frequent spans ingested into Dynatrace. All the errors seem to be caused by requests for a specific product ID or a faulty entry in the product database. To install the OpenTelemetry Demo application dashboard, upload the JSON file.
With the world’s increased reliance on digital services and the organizational pressure on IT teams to innovate faster, the need for DevOps monitoring tools has grown exponentially. But when and how does DevOps monitoring fit into the process? And how do DevOps monitoring tools help teams achieve DevOps efficiency?
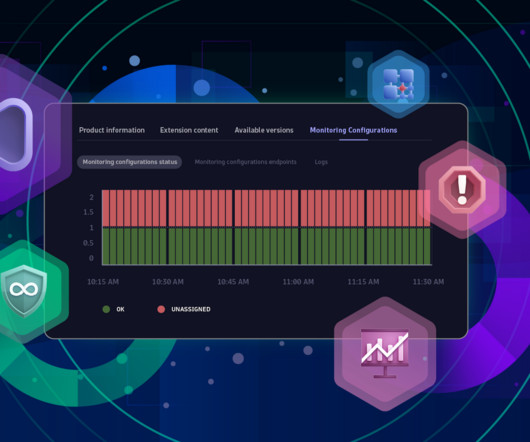
Introducing Dynatrace Extensions In short, the Extensions app is the central place for configuring, monitoring, and discovering extensions. Its easy to adapt to changes that are common in cloud environments with just a few clicks: Has the OneAgent found an unsupervised database? You can call upon it to fill any monitoring gaps.
But this approach introduced new complexity and a need for more advanced cloud monitoring capabilities. Dynatrace’s cloud monitoring capabilities are helping Porsche Informatik to simplify complexity and drive improved digital experiences for customers. Simplifying complexity with cloud monitoring. The key value of Dynatrace.
Monitoring with ?the Readers who share our privacy concerns, please note, all the data we monitor is publicly available. . The insights in this b log rely heavily on data captured by Dynatrace’s proactive synthetic monitoring capabilities. We ’ve also been monitoring U. the Dynatrace®?
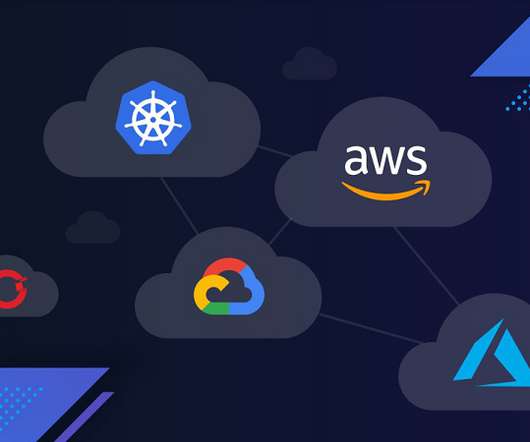
IT infrastructure is the heart of your digital business and connects every area – physical and virtual servers, storage, databases, networks, cloud services. This shift requires infrastructure monitoring to ensure all your components work together across applications, operating systems, storage, servers, virtualization, and more.
But this approach introduced new complexity and a need for more advanced cloud monitoring capabilities. Dynatrace’s cloud monitoring capabilities are helping Porsche Informatik to simplify complexity and drive improved digital experiences for customers. Simplifying complexity with cloud monitoring. The key value of Dynatrace.
Due to its versatility for storing information in both structured and unstructured formats, PostgreSQL is the fourth most used standard in modern database management systems (DBMS) worldwide 1. To conclude, GUIs are a vital addition to ease the lives of database users and developers.
Incremental Backups: Speeds up recovery and makes data management more efficient for active databases. Improved JSON Handling & Security: Improved logical replication and the new MAINTAIN privilege give database administrators more control and flexibility. Start your free trial today!
Dynatrace’s OneAgent automatically captures PurePaths and analyzes transactions end-to-end across every tier of your application technology stack with no code changes, from the browser all the way down to the code and database level. Monitoring-as-code requirements at Dynatrace.
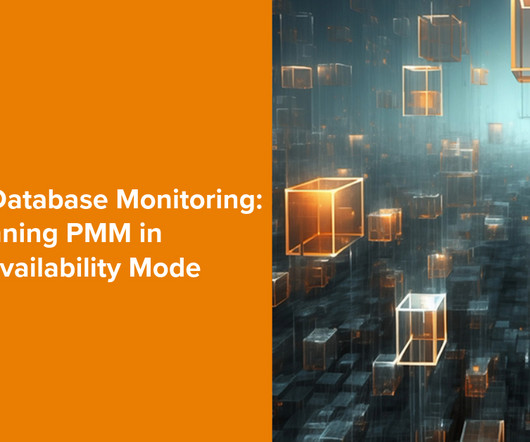
Percona Monitoring and Management (PMM) has become a valuable tool for database professionals, providing comprehensive insights into database health and performance. A recent update (version 2.41.0) introduced a significant enhancement: the ability to run PMM in high availability (HA) mode.
Percona Monitoring and Management (PMM) overview dashboards were always meant to be a starting point for DBAs to check the overall health of the databases. Current overview dashboards can be a little overwhelming, based on an approach of “full visibility.”
The problem could be in the database, the HTTP connection, the configuration of the message, or an outage on the sending or receiving end. Observability platforms address the challenge of message queue monitoring by capturing and analyzing queue data. The importance of an observability platform approach. Watch webinar now!
The problem could be in the database, the HTTP connection, the configuration of the message, or an outage on the sending or receiving end. Observability platforms address the challenge of message queue monitoring by capturing and analyzing queue data. The importance of an observability platform approach.
It’s a common scenario to have a Percona Monitoring and Management (PMM) server running on Kubernetes and also desire to monitordatabases that are running outside the Kubernetes cluster. The Ingress NGINX Controller is one of the most popular choices for managing the inbound traffic to K8s.
We’re continuously improving our Diagnostic tools capabilities and workflows and are currently working on improving the Top database statements , Top Web requests , and Exception analysis views. The post Boost application performance with improved CPU analysis across all your deep-monitored workloads appeared first on Dynatrace blog.
Logs provide answers, but monitoring is a challenge Manual tagging is error-prone Making sure your required logs are monitored is a task distributed between the data owner and the monitoring administrator. Often, it comes down to provisioning YAML configuration files and listing the files or log sources required for monitoring.
Heading into 2024, SQL databases will remain essential in data management, increasingly using distributed systems to meet growing needs for scalability and reliability. According to 2023 statistics, 49% of web applications use an SQL-based database , with SQL having a 75% adoption rate in the IT industry.
Percona Monitoring and Management (PMM) boasts many functionalities that support its extension, be it by using Custom Queries, Custom Scripts, or by collecting data from already available External Exporters. In this short blog post, we will see how to quickly (and easily) monitor a PostgreSQL cluster managed by Patroni.
We organize all of the trending information in your field so you don't have to. Join 5,000+ users and stay up to date on the latest articles your peers are reading.
You know about us, now we want to get to know you!
Let's personalize your content
Let's get even more personalized
We recognize your account from another site in our network, please click 'Send Email' below to continue with verifying your account and setting a password.


Let's personalize your content