This site uses cookies to improve your experience. To help us insure we adhere to various privacy regulations, please select your country/region of residence. If you do not select a country, we will assume you are from the United States. Select your Cookie Settings or view our Privacy Policy and Terms of Use.
Cookie Settings
Cookies and similar technologies are used on this website for proper function of the website, for tracking performance analytics and for marketing purposes. We and some of our third-party providers may use cookie data for various purposes. Please review the cookie settings below and choose your preference.
Used for the proper function of the website
Used for monitoring website traffic and interactions
Cookie Settings
Cookies and similar technologies are used on this website for proper function of the website, for tracking performance analytics and for marketing purposes. We and some of our third-party providers may use cookie data for various purposes. Please review the cookie settings below and choose your preference.
Strictly Necessary: Used for the proper function of the website
Performance/Analytics: Used for monitoring website traffic and interactions
However, to tactically assess the website'sperformance , it needs to be measured in a well-thought-out manner. Core Web Vitals is a key performance metric that analyzes the website'sperformance by investigating the data and provides a strategic platform to scale up the website's user experience.
CDNs play a crucial role in enhancing websiteperformance and user experience. However, the extended infrastructure of CDNs requires diligent monitoring to ensure optimal performance and identify potential issues. It involves monitoring and analyzing various metrics and data points to ensure the CDN functions as expected.
They collect data from multiple sources through real user monitoring , synthetic monitoring, network monitoring, and application performance monitoring systems. This data provides organizations with end-to-end visibility of the entire user journey across the tech stack.
Monitoring application and websiteperformance has become critical to delivering a smooth digital experience to users. With users' attention spans dwindling at an ever-increasing rate, even minor hiccups in performance can cause users to abandon an app or website.
Google Lighthouse is merely one tool in a complete performance toolkit. What it’s not is a complete picture of how your websiteperforms in the real world. Sure, we can glean plenty of insights about a site’s performance and even spot issues that ought to be addressed to speed things up. But beware!
Data collection is an example,” Reitbauer says. Companies are all using the same data. Open standards enable interoperability and data exchange among different products or services so technologies can be widely adopted. Reitbauer’s own journey with open source started by contributing to open standards for telemetry data.
With an improved user experience and some additional data available, benchmarking your competition is now easier than ever! After a quick reminder about why and how you can use the performance comparison feature, let’s discover what’s new under the hood!
That means that before we even get the first response byte for our page we actually have to send data back and forth between the browser and a server eight times! Thats where network latency comes in, or network round trip time (RTT) if we look at the time it takes to send data to a server and receive a response in the browser.
Moreover, websiteperformance problems during peak times have a clear economic impact. I’m going to log into the POS [point-of-sale system] and reproduce what happened on Thanksgiving, then log into the Dynatrace console and see the data come through.”. Consider recent Dynatrace data from “The 2022 CISO Research Report: Retail.”
These approaches emphasize extracting data from user sessions, one of the more commonly used sources of business analytics metrics; additional sources include server-side data, logs, and external metrics. Let’s illustrate a simple use case for a retail outlet.
This was because the amount of effort required often exceeded the capacity of the performance team, and also because ongoing work on various features and capabilities often got in the way. As websites become heavier and more complex , the task of maintaining performance becomes ever more challenging. More after jump!
A/B testing involves comparing two or more variations of a webpage or user experience to determine which one performs better in achieving predefined goals. A/B testing plays a significant role in improving conversion rates, user engagement, and overall websiteperformance.
Using data to optimize your website'sperformance is an effective way to discover new test ideas and insights. This can help you increase your website's overall conversion rate, as well as boost your email subscriptions or product purchases. In this article, we'll discuss how to do just that.
Deep packet inspection (DPI) techniques are also deployed by China’s Great Firewall to extensively inspect incoming and outgoing unencrypted network traffic for packets, filtering and blocking data packets that contain sensitive information that is censored by China. In Conclusion: Monitoring WebsitePerformance from China.
Let’s find out how to work with different types of Core Web Vitals data and how monitoring can help you gain a deeper insight into user experiences and help you optimize them. Large preview ) What Are The Different Types Of Core Web Vitals Data? It also doesn’t include any debug data to help you optimize your metrics.
They get even MORE impatient when it comes to website speed. From this research we’ve chosen to invest even more time in making every aspect of the new FT.com website even faster over the coming months “ They add a 5-second delay to each page load time. . Want proof? “ The results were clear—speed matters!
Deep packet inspection (DPI) techniques are also deployed by China’s Great Firewall to extensively inspect incoming and outgoing unencrypted network traffic for packets, filtering and blocking data packets that contain sensitive information that is censored by China. In Conclusion: Monitoring WebsitePerformance from China.
Data collection is an example,” Reitbauer says. Companies are all using the same data. Open standards enable interoperability and data exchange among different products or services so technologies can be widely adopted. Reitbauer’s own journey with open source started by contributing to open standards for telemetry data.
Data collection is an example,” Reitbauer says. Companies are all using the same data. Open standards enable interoperability and data exchange among different products or services so technologies can be widely adopted. Reitbauer’s own journey with open source started by contributing to open standards for telemetry data.
If you plan to do business online with China, its Internet infrastructure and the Great Firewall might greatly impact your websiteperformance. To investigate this topic, let’s first check how important your websiteperformance is to your online business. Why Should You Monitor Your WebsitePerformance?
You may have a lean, agile, responsive site design only to find it gradually loaded down with more and more “extras” that are often put onto the site by marketing departments or business leaders who are not always thinking about websiteperformance. Graph of resource request chains on a typical news media website.
If you plan to do business online with China, its Internet infrastructure and the Great Firewall might greatly impact your websiteperformance. To investigate this topic, let’s first check how important your websiteperformance is to your online business. Why Should You Monitor Your WebsitePerformance?
If you plan to do business online with China, its Internet infrastructure and the Great Firewall might greatly impact your websiteperformance. To investigate this topic, let’s first check how important your websiteperformance is to your online business. Why Should You Monitor Your WebsitePerformance?
Jack Lenox’s article “How Improving WebsitePerformance Can Help Save The Planet” on Smashing is a better deep dive. He points to websites that will test your site. Data transfer over the wire 2. Data transfer over the wire 2. Energy intensity of web data 3. Website traffic.
Take, for example, The Web Almanac , the golden collection of Big Data combined with the collective intelligence from most of the authors listed below, brilliantly spearheaded by Google’s @rick_viscomi. A collection of practical articles on front-end websiteperformance for front-end developers. Web Performance Tuning.
Google uses anonymized data from Chrome users to feedback metrics and makes these available in the Chrome User Experience Report (CrUX). That data is what they are using to measure these three metrics for the search rankings. CrUX data is available in a number of tools, including in Google Search Console for your site.
In particular, the increase in the amount of downloaded JavaScript can have a direct impact on websiteperformance. And there are other aspects of framework usage that can impact performance as well. However, when reviewing this data, it’s important not to conflate correlation and causation.
<img data-src="turtle.jpg" alt="Lazy turtle" class="lazy"> Native Lazy Loading. In order to do hybrid lazy loading, you need to mark up your lazy content using the data attributes instead of the real ones (such as in JavaScript-driven lazy loading), and to add the loading="lazy" attribute. <img
Introduction to digital analytics Digital analytics encompasses the measurement, collection, analysis, and interpretation of data from various digital platforms, such as websites and mobile applications.
Deep packet inspection (DPI) techniques are also deployed by China’s Great Firewall to extensively inspect incoming and outgoing unencrypted network traffic for packets, filtering and blocking data packets that contain sensitive information that is censored by China. In Conclusion: Monitoring WebsitePerformance from China.
Deep packet inspection (DPI) techniques are also deployed by China’s Great Firewall to extensively inspect incoming and outgoing unencrypted network traffic for packets, filtering and blocking data packets that contain sensitive information that is censored by China. In Conclusion: Monitoring WebsitePerformance from China.
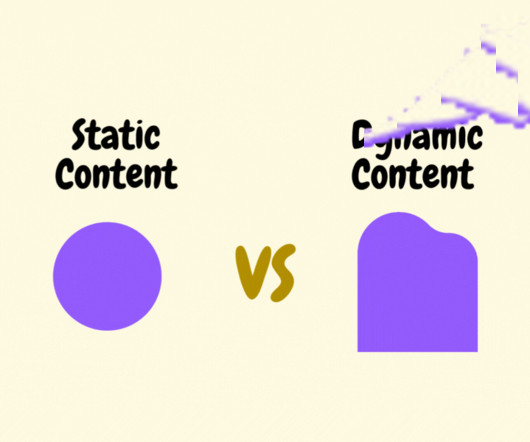
As the website grows, the maintenance of static content can become more cumbersome and require robust content management practices.â€What Each dynamic request may require transmitting additional data, such as HTML templates, database records, and dynamically generated media. How Can You Boost WebsitePerformance?
Synthetic Monitoring: Continuous WebsitePerformance Monitoring. But as we’ve mentioned, if your pages don’t perform to your visitors’ expectations, they’ll quickly lose interest and leave. Dotcom-Monitor Website Monitoring. Again, for those running WordPress, we recommend WP-Rocket.
What To Expect With CDN Security CDNs hold a lot of data and can be a target for hackers. Common CDN Security RisksWhile CDNs are essential for improving websiteperformance, they also introduce certain security risks. If the TLS certificate is breached, attackers can obtain access to sensitive data and also deceive users.
We normally focus solely on the performance aspect, but today we want to dive into additional ways you can optimize images for the web. The file size of your images of course is very important, but SEO and social media also play an important part in helping your websiteperform and convert better.
As the website grows, the maintenance of static content can become more cumbersome and require robust content management practices.What is Dynamic Content?Dynamic Each dynamic request may require transmitting additional data, such as HTML templates, database records, and dynamically generated media.
At that time, I was working as a freelance websiteperformance consultant. This number is based on a very small subset of libraries but is not incorrect by a big margin as I was seeing this much gain on all of the websites that I tested. Visitors, especially those on mobile devices, enjoy reduced data transfer.
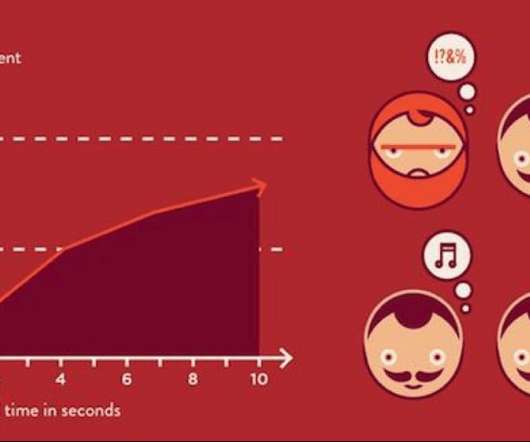
In the chart below, you can see the data for Patient A and Patient B. Slow websites are just one problem, but for those of us who spend much of our work and personal time online, slow sites creates extra friction in an already friction-filled world. Web stress" is measurable When websitesperform poorly, we react badly.
Even if your website is designed with usability in mind, these factors impede users from fully benefiting from the website’s features. This is why performance is crucial when building websites. Consider Google Analytics, which collects and sends tracking data using navigator.sendBeacon().
These factors will be discussed later in the article, but first, let's discuss why your website is not fast enough. Page loading speed test Before conducting any further tests, a website owner must determine at what speed his website loads. The test includes a waterfall breakdown and a visual website preview at the bottom.
Even though the code is partially obfuscated as part of the minification process, we risk exposing API endpoints or other data reserved for admin users. Websiteperformance is not consistent across devices. This estimation doesn’t include parsing and execution times which also affects websiteperformance.
Ecommerce software systems also give firms insightful data on their inventory performance. Businesses may evaluate product performance, spot slow-moving merchandise, and make data-driven decisions to optimize inventory using comprehensive reporting and analytics.
The next thing you’ll see is thousands and thousands of people flooding into your amazing website from all corners of the world expecting to have the same experience regardless of their location. So you finally launched your service worldwide, great! Here is where things get tricky.
Prometheus is used to monitor and collect metrics about your infrastructure and applications and outputs that data in the form of dashboards and visualizations. One of the major differences between Prometheus and other monitoring tools is that Prometheus uses its own datastore to collect data on the metrics it can monitor.
We organize all of the trending information in your field so you don't have to. Join 5,000+ users and stay up to date on the latest articles your peers are reading.
You know about us, now we want to get to know you!
Let's personalize your content
Let's get even more personalized
We recognize your account from another site in our network, please click 'Send Email' below to continue with verifying your account and setting a password.


Let's personalize your content