This site uses cookies to improve your experience. To help us insure we adhere to various privacy regulations, please select your country/region of residence. If you do not select a country, we will assume you are from the United States. Select your Cookie Settings or view our Privacy Policy and Terms of Use.
Cookie Settings
Cookies and similar technologies are used on this website for proper function of the website, for tracking performance analytics and for marketing purposes. We and some of our third-party providers may use cookie data for various purposes. Please review the cookie settings below and choose your preference.
Used for the proper function of the website
Used for monitoring website traffic and interactions
Cookie Settings
Cookies and similar technologies are used on this website for proper function of the website, for tracking performance analytics and for marketing purposes. We and some of our third-party providers may use cookie data for various purposes. Please review the cookie settings below and choose your preference.
Strictly Necessary: Used for the proper function of the website
Performance/Analytics: Used for monitoring website traffic and interactions
When we launched the new Dynatrace experience, we introduced major updates to the platform, including Grail ™, our innovative data lakehouse unifying observability, security, and business data, and Dynatrace Query Language ( DQL ) for accessing and exploring unified data.
Fast and efficient log analysis is critical in todays data-driven IT environments. Dynatrace segments simplify and streamline data organization in large and complex IT environments, providing pre-scoped data without compromising performance. This fosters collaboration and alignment across departments and teams.
As modern multicloud environments become more distributed and complex, having real-time insights into applications and infrastructure while keeping data residency in local markets is crucial. By keeping data within the region, Dynatrace ensures compliance with data privacy regulations and offers peace of mind to its customers.
AI transformation, modernization, managing intelligent apps, safeguarding data, and accelerating productivity are all key themes at Microsoft Ignite 2024. Adopting AI to enhance efficiency and boost productivity is critical in a time of exploding data, cloud complexities, and disparate technologies.
Still, while DevOps practices enable developer agility and speed as well as better code quality, they can also introduce complexity and data silos. Software development is often at the center of this speed-quality tradeoff. Automating DevOps practices boosts development speed and code quality.
Key insights for executives: Increase operational efficiency with automation and AI to foster seamless collaboration : With AI and automated workflows, teams work from shared data, automate repetitive tasks, and accelerate resolutionfocusing more on business outcomes. No delays and overhead of reindexing and rehydration.
In 2019, according to Evans Data Corporation, there were 23.9 In an attempt to hold their place within the market, developers are having to speed their process up whilst delivering products of ever-increasing quality. Often speed and quality seem at odds with one another, but in reality, this isn’t the case.
Efficient data processing is crucial for businesses and organizations that rely on big data analytics to make informed decisions. One key factor that significantly affects the performance of data processing is the storage format of the data.
For IT infrastructure managers and site reliability engineers, or SREs , logs provide a treasure trove of data. But on their own, logs present just another data silo as IT professionals attempt to troubleshoot and remediate problems. Data volume explosion in multicloud environments poses log issues.
by Jasmine Omeke , Obi-Ike Nwoke , Olek Gorajek Intro This post is for all data practitioners, who are interested in learning about bootstrapping, standardization and automation of batch data pipelines at Netflix. You may remember Dataflow from the post we wrote last year titled Data pipeline asset management with Dataflow.
When creating applications that store and analyze large amounts of data, such as time series, log data, or event-storing ones, developing a good and future-proof data model can be a difficult task. Choosing the right data types in PostgreSQL can significantly impact your database's performance and efficiency.
Developers today are expected to ship features at lightning speed while also being responsible for database health, an area that traditionally required deep expertise. Managing databases has only become more difficult with the explosion of data and complexity, and Metis is the perfect addition to extend and accelerate our capabilities.
We are in the era of data explosion, hybrid and multicloud complexities, and AI growth. Dynatrace analyzes billions of interconnected data points to deliver answers, not just data and dashboards sending signals without a path to resolution. Picture gaining insights into your business from the perspective of your users.
While data lakes and data warehousing architectures are commonly used modes for storing and analyzing data, a data lakehouse is an efficient third way to store and analyze data that unifies the two architectures while preserving the benefits of both. What is a data lakehouse? How does a data lakehouse work?
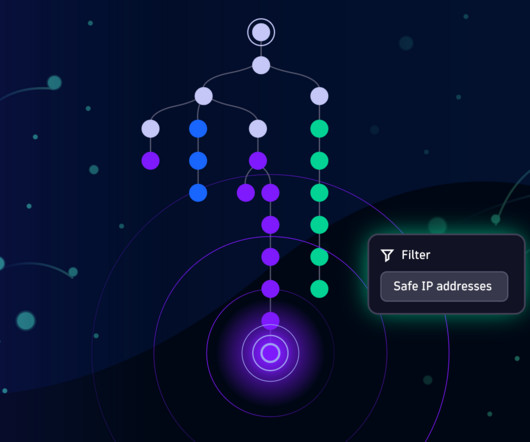
Character precision on a petabyte scale Security Investigator increases the speed of investigation flows and the precision of evidence, leading to higher efficiency and faster results. View raw content details when you need them Data ingested into Grail is kept in its original format.
It can scale towards a multi-petabyte level data workload without a single issue, and it allows access to a cluster of powerful servers that will work together within a single SQL interface where you can view all of the data. This feature-packed database provides powerful and rapid analytics on data that scales up to petabyte volumes.
To help you raise the quality of your investigation results, Dynatrace offers an easy way of structuring data using DPL Architect. The best thing: the whole process is performed on read when the query is executed, which means you have full flexibility and don’t need to define a structure when ingesting data. >>
Move beyond logs-only security: Embrace a comprehensive, end-to-end approach that integrates all data from observability and security. Collect observability and security data user behavior, metrics, events, logs, traces (UMELT) once, store it together and analyze in context. For example, user behavior helps identify attacks or fraud.
Some time ago, at a restaurant near Boston, three Dynatrace colleagues dined and discussed the growing data challenge for enterprises. At its core, this challenge involves a rapid increase in the amount—and complexity—of data collected within a company. Work with different and independent data types. Thus, Grail was born.
In today’s data-driven world, businesses across various industry verticals increasingly leverage the Internet of Things (IoT) to drive efficiency and innovation. Both methods allow you to ingest and process raw data and metrics. The ADS-B protocol differs significantly from web technologies.
Performance, errors, and user experience Dynatrace has long understood the importance of performance as a foundational component of user experience and the impact that page speed and any friction introduced by errors have on user behavior. The addition of more and more metrics over time has only made this increasingly complex.
The jobs executing such workloads are usually required to operate indefinitely on unbounded streams of continuous data and exhibit heterogeneous modes of failure as they run over long periods. Performance is usually a primary concern when using stream processing frameworks.
But IT teams need to embrace IT automation and new data storage models to benefit from modern clouds. As they enlist cloud models, organizations now confront increasing complexity and a data explosion. Data explosion hinders better data insight.
Considering the latest State of Observability 2024 report, it’s evident that multicloud environments not only come with an explosion of data beyond humans’ ability to manage it. It’s increasingly difficult to ingest, manage, store, and sort through this amount of data. You can find the list of use cases here.
Observability-driven DevOps enables state agencies to deliver higher-quality software faster MNIT can make better, data-driven release decisions by integrating observability data into the DevOps team’s delivery pipelines. IT staff from different tech disciplines can look at the same data and collaborate,” Smith said.
This shift is driving increased adoption of the Dynatrace platform, as our customers leverage our unified observability solutionpowered by Grail, our hyperscale data lakehouse, designed to store, process, and query massive volumes of observability, security, and business data with high efficiency and speed.
Software and data are a company’s competitive advantage. But for software to work perfectly, organizations need to use data to optimize every phase of the software lifecycle. The only way to address these challenges is through observability data — logs, metrics, and traces. Teams interact with myriad data types.
Grail: Enterprise-ready data lakehouse Grail, the Dynatrace causational data lakehouse, was explicitly designed for observability and security data, with artificial intelligence integrated into its foundation. Tables are a physical data model, essentially the type of observability data that you can store.
AI data analysis can help development teams release software faster and at higher quality. So how can organizations ensure data quality, reliability, and freshness for AI-driven answers and insights? And how can they take advantage of AI without incurring skyrocketing costs to store, manage, and query data?
In a digital-first world, site reliability engineers and IT data analysts face numerous challenges with data quality and reliability in their quest for cloud control. Increasingly, organizations seek to address these problems using AI techniques as part of their exploratory data analytics practices.
Below is a sample SRG dashboard for these signals: Latency Latency refers to the amount of time that data takes to transfer from one point to another within a system. In the context of Easytravel, one can measure the speed at which a specific page of the application responds after a user clicks on it. Start a 15-day free trial today.
Welcome, data enthusiasts! Whether you’re a seasoned IT expert or a marketing professional looking to improve business performance, understanding the data available to you is essential. In this blog series, we’ll guide you through creating powerful dashboards that transform complex data into actionable insights.
I have ingested important custom data into Dynatrace, critical to running my applications and making accurate business decisions… but can I trust the accuracy and reliability?” ” Welcome to the world of data observability. At its core, data observability is about ensuring the availability, reliability, and quality of data.
How do you get more value from petabytes of exponentially exploding, increasingly heterogeneous data? The short answer: The three pillars of observability—logs, metrics, and traces—converging on a data lakehouse. To solve this problem, Dynatrace launched Grail, its causational data lakehouse , in 2022.
I owe a huge debt of gratitude to both Zachary and Eliyahu — not only for the work they put into developing those libraries but also for the support they have given me as I came up to speed on both the technical and Jewish religious guidelines (halacha) needed to use them.
In data analysis, the need for fast query execution and data retrieval is paramount. Among numerous database management systems, ClickHouse stands out for its originality and, one could say, a specific niche, which, in my opinion, complicates its expansion in the database market.
After optimizing containerized applications processing petabytes of data in fintech environments, I've learned that Docker performance isn't just about speed it's about reliability, resource efficiency, and cost optimization. Let's dive into strategies that actually work in production.
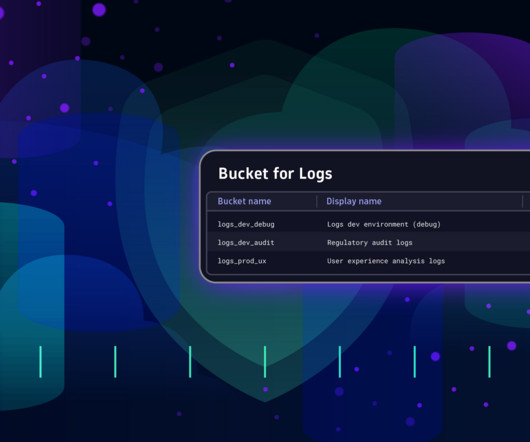
Streamline privacy requirements with flexible retention periods Data retention is a critical aspect of data handling, and it’s not just about privacy compliance—it’s about having the flexibility to optimize data storage times in Grail for your Dynatrace use cases. Grail buckets function like folders in a file system.
Incremental Backups: Speeds up recovery and makes data management more efficient for active databases. Faster Write Operations: Enhancements to the write-ahead log (WAL) processing double PostgreSQLs ability to handle concurrent transactions, improving uptime and data accessibility. Start your free trial today!
Every image you hover over isnt just a visual placeholder; its a critical data point that fuels our sophisticated personalization engine. This nuanced integration of data and technology empowers us to offer bespoke content recommendations. This queue ensures we are consistently capturing raw events from our global userbase.
we significantly re-designed the Data Masking Component. Introduced an in-memory dictionary term cache that allows significant speed-up of dictionary operations. In Percona Server for MySQL 8.0.41 / 8.4.4, Introduced masking_dictionaries_flush() User Defined Function.
In recent years, technologists and business leaders have dubbed data as “the new oil.” Because both oil and data require their owners to refine them to unleash their true value. So how do you realize the vast potential of data while protecting it from threats? Is data the new oil? And friction is a speed problem.”
To stay competitive in an increasingly digital landscape, organizations seek easier access to business analytics data from IT to make better business decisions faster. As organizations add more tools, it creates a demand for common tooling, shared data, and democratized access. These technologies generate a crush of observability data.
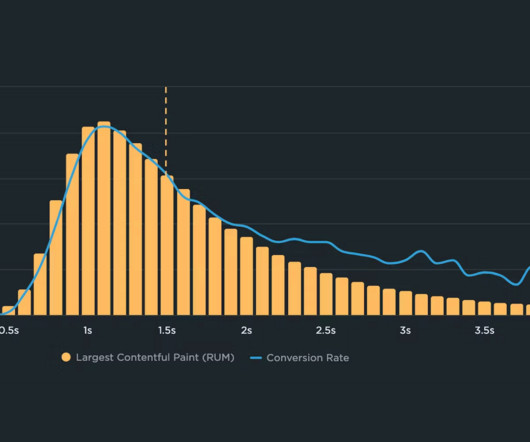
If you could measure the impact of site speed on your business, how valuable would that be for you? Here's the truth: The business folks in your organization probably don't care about page speed metrics. But that doesn't mean they don't care about page speed. Say hello to correlation charts – your new best friend.
We organize all of the trending information in your field so you don't have to. Join 5,000+ users and stay up to date on the latest articles your peers are reading.
You know about us, now we want to get to know you!
Let's personalize your content
Let's get even more personalized
We recognize your account from another site in our network, please click 'Send Email' below to continue with verifying your account and setting a password.


Let's personalize your content