This site uses cookies to improve your experience. To help us insure we adhere to various privacy regulations, please select your country/region of residence. If you do not select a country, we will assume you are from the United States. Select your Cookie Settings or view our Privacy Policy and Terms of Use.
Cookie Settings
Cookies and similar technologies are used on this website for proper function of the website, for tracking performance analytics and for marketing purposes. We and some of our third-party providers may use cookie data for various purposes. Please review the cookie settings below and choose your preference.
Used for the proper function of the website
Used for monitoring website traffic and interactions
Cookie Settings
Cookies and similar technologies are used on this website for proper function of the website, for tracking performance analytics and for marketing purposes. We and some of our third-party providers may use cookie data for various purposes. Please review the cookie settings below and choose your preference.
Strictly Necessary: Used for the proper function of the website
Performance/Analytics: Used for monitoring website traffic and interactions
Journald provides unified structured logging for systems, services, and applications, eliminating the need for custom parsing for severity or details. It supports multi-line logs, handles log rotation, and even includes mechanisms to check for data corruption. Thanks to its structured and binary format, Journald is quick and efficient.
In modern containerized environments, teams often deploy Kubernetes across mixed operatingsystems, creating a situation where both Linux and Windows nodes reside in the same cluster. Integrating data at an OS-agnostic cluster level is another hurdle, often leading to data silos and incomplete visibility.
Log management is an organization’s rules and policies for managing and enabling the creation, transmission, analysis, storage, and other tasks related to IT systems’ and applications’ log data. In cloud-native environments, there can also be dozens of additional services and functions all generating data from user-driven events.
IT operations analytics is the process of unifying, storing, and contextually analyzing operationaldata to understand the health of applications, infrastructure, and environments and streamline everyday operations. Here are the six steps of a typical ITOA process : Define the data infrastructure strategy.
The nirvana state of system uptime at peak loads is known as “five-nines availability.” In its pursuit, IT teams hover over system performance dashboards hoping their preparations will deliver five nines—or even four nines—availability. How can IT teams deliver system availability under peak loads that will satisfy customers?
The study analyzes factual Kubernetes production data from thousands of organizations worldwide that are using the Dynatrace Software Intelligence Platform to keep their Kubernetes clusters secure, healthy, and high performing. Kubernetes is emerging as the “operatingsystem” of the cloud. Kubernetes moved to the cloud in 2022.
Recent improvements in OneAgent runtime-data handling. OperatingSystems are not always set up in the same way. Storage mount points in a system might be larger or smaller, local or remote, with high or low latency, and various speeds. Customizable location of large runtime files. See details below. See details below.
The newly introduced step-by-step guidance streamlines the process, while quick data flow validation accelerates the onboarding experience even for power users. After successfully installing OneAgent, the log ingestion wizard provides a host selector drop-down to validate the data flow.
Structured Query Language (SQL) is a simple declarative programming language utilized by various technology and business professionals to extract and transform data. Offering comprehensive access to files, software features, and the operatingsystem in a more user-friendly manner to ensure control.
The system is inconsistent, slow, hallucinatingand that amazing demo starts collecting digital dust. Two big things: They bring the messiness of the real world into your system through unstructured data. People have been building data products and machine learning products for the past couple of decades. The way out?
Benefitting from the openness of the Dynatrace platform, our partners can build custom solutions on top of the vast observability data ingested by Dynatrace, creating apps that address unique business challenges. Spica Solution’s CMDB app secured second place because it effectively addresses a significant business need.
Do you keep an eye on the support of distributions and versions of operatingsystems within your environment? With this information, you can find answers to questions such as: Which operatingsystems and versions does Dynatrace support? Which operatingsystems and versions does Dynatrace support?
CPU consumption in Unix/Linux operatingsystems is studied using eight different metrics: User CPU time, System CPU time, nice CPU time, Idle CPU time, Waiting CPU time, Hardware Interrupt CPU time, Software Interrupt CPU time, Stolen CPU time. User CPU Time and System CPU Time.
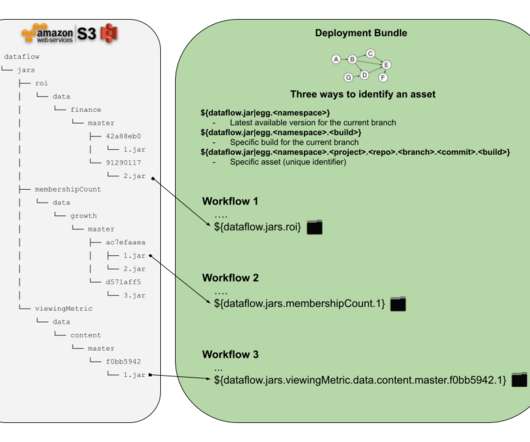
JAR) form to be executed as part of the user defined data pipeline. data pipeline ?—?a DAG) for the purpose of transforming data using some business logic. Netflix homegrown CLI tool for data pipeline management. task, an atomic unit of data transformation logic, a non-separable execution block in the workflow chain.
With Dynatrace actively managing business-critical applications, some of our globally distributed enterprise customers require Dynatrace Managed to continue operating even when an entire data center goes down. Near-zero RPO and RTO—monitoring continues seamlessly and without data loss in failover scenarios.
Heres more about the VMware security advisory and how you can quickly find affected systems using Dynatrace so you canautomate remediation efforts. With a TOCTOU vulnerability, an attacker can manipulate a system between the time a resource’s state is checked and when it’s used, also known as a race condition.
To make this possible, the application code should be instrumented with telemetry data for deep insights, including: Metrics to find out how the behavior of a system has changed over time. Logs represent event data in plain-text, structured or binary format. Traces help find the flow of a request through a distributed system.
OpenTelemetry , the open source observability tool, has become the go-to standard for instrumenting custom applications to collect observability telemetry data. For this third and final part of our series, we saved the best for last: How you can enhance telemetry data even more and with less effort on your end with Dynatrace OneAgent.
Symptoms : No data is provided for affected metrics on dashboards, alerts, and custom device pages populated by the affected extension metrics. Operatingsystems. Future Dynatrace OneAgent operatingsystems support changes. The following operatingsystems will no longer be supported starting 01 March 2022.
Memory usage is one of the most important aspects of the database system. How Databases Read Data To understand how to deal with memory, we need to understand how things work. How Databases Read Data To understand how to deal with memory, we need to understand how things work. This in turn affects our users and the business.
Symptoms : Metrics provided by affected extensions may stop working, such that no data is provided for affected metrics on dashboards, alerts, and custom device pages populated by the affected extension metrics. Operatingsystems. Future Dynatrace OneAgent operatingsystems support changes. x86 (64bit-only).
Oracle Database is a commercial, proprietary multi-model database management system produced by Oracle Corporation, and the largest relational database management system (RDBMS) in the world. Compare ease of use across compatibility, extensions, tuning, operatingsystems, languages and support providers. PostgreSQL.
These rapid changes — as well as the increasing volume and variety of data created — require a new approach to observability. When an application runs on a single large computing element, a single operatingsystem can monitor every aspect of the system. Just as the code is monolithic, so is the logging.
Hyper-V plays a vital role in ensuring the reliable operations of data centers that are based on Microsoft platforms. Microsoft Hyper-V is a virtualization platform that manages virtual machines (VMs) on Windows-based systems. Optimize resource allocation, identify bottlenecks, and improve overall system performance.
Operatingsystems support. Future Dynatrace Managed operatingsystems support changes. The following operatingsystems will no longer be supported starting 01 September 2021. The following operatingsystems will no longer be supported starting 01 October 2021. Linux: Amazon Linux AMI 2017.x.
With the availability of Linux on IBM Z and LinuxONE, the IBM Z platform brings a familiar host operatingsystem and sustainability that could yield up to 75% energy reduction compared to x86 servers. Deploying your critical applications on additional host operatingsystems increases the dependencies for observability.
Protecting IT infrastructure, applications, and data requires that you understand security weaknesses attackers can exploit. Vulnerability assessment is the process of identifying, quantifying, and prioritizing the cybersecurity vulnerabilities in a given IT system. Dynatrace news. Assess risk. The next step is risk assessment.
PostgreSQL graphical user interface (GUI) tools help these open source database users to manage, manipulate, and visualize their data. PostgreSQL is the fourth most popular database management system in the world, and heavily used in all sizes of applications from small to large. Convenient navigation among data.
A log is a detailed, timestamped record of an event generated by an operatingsystem, computing environment, application, server, or network device. Logs can include data about user inputs, system processes, and hardware states. “Logging” is the practice of generating and storing logs for later analysis.
IBM i, formerly known as iSeries, is an operatingsystem developed by IBM for its line of IBM i Power Systems servers. It is based on the IBM AS/400 system and is known for its reliability, scalability, and security features. The extension runs remotely from your Dynatrace ActiveGates and connects to your IBM i system.
Because OneAgent operates on your critical hosts where the services that comprise your business applications are located, Dynatrace must ensure the highest possible security in monitoring the operatingsystems and services that run on these hosts. It leverages Linux kernel system capabilities.
A distributed storage system is foundational in today’s data-driven landscape, ensuring data spread over multiple servers is reliable, accessible, and manageable. This guide delves into how these systems work, the challenges they solve, and their essential role in businesses and technology.
As we did with IBM Power , we’re delighted to share that IBM and Dynatrace have joined forces to bring the Dynatrace Operator, along with the comprehensive capabilities of the Dynatrace platform, to Red Hat OpenShift on the IBM Z and LinuxONE architecture (s390x).
This growth was spurred by mobile ecosystems with Android and iOS operatingsystems, where ARM has a unique advantage in energy efficiency while offering high performance. Legacy data center infrastructure and software support have kept all the benefits of ARM at, well… arm’s length.
Containers enable developers to package microservices or applications with the libraries, configuration files, and dependencies needed to run on any infrastructure, regardless of the target system environment. This means organizations are increasingly using Kubernetes not just for running applications, but also as an operatingsystem.
According to the Kubernetes in the Wild 2023 report, “Kubernetes is emerging as the operatingsystem of the cloud.” Kubernetes also gives developers freedom of choice when selecting operatingsystems, container runtimes, storage engines, and other key elements for their Kubernetes environments. Ease of use.
As organizations continue to modernize their technology stacks, many turn to Kubernetes , an open source container orchestration system for automating software deployment, scaling, and management. Providing at-a-glance data makes it possible for teams to quickly identify high-level issues and then drill down into the details.
Traditional computing models rely on virtual or physical machines, where each instance includes a complete operatingsystem, CPU cycles, and memory. There is no need to plan for extra resources, update operatingsystems, or install frameworks. The provider is essentially your system administrator.
Modern observability and security require comprehensive access to your hosts, processes, services, and applications to monitor system performance, conduct live debugging, and ensure application security protection. Changes are introduced on a controlled schedule, typically once a week, to reduce the risk of affecting customer systems.
Understanding that the first mile of getting data in can often be the hardest, Dynatrace continues to invest in log ingest, offering a range of out-of-the-box solutions within the Dynatrace Platform and apps. Native support for syslog messages extends our infrastructure log support to all Linux/Unix systems and network devices.
Running metric queries on a subset of entities for live monitoring and system overviews. A powerful query layer for time series data that introduces the concept of metric transformations. The new API allows you to realize use cases in reporting and data analytics and to further integrate custom applications with Dynatrace.
User demographics , such as app version, operatingsystem, location, and device type, can help tailor an app to better meet users’ needs and preferences. Here are some ways observability data is important to mobile app performance monitoring. Issue remediation. Proactive monitoring. Performance optimization.
Historically artists had these machines built for them at their desks and only had access to the data and applications when they were in the office. We needed a system that could manage hundreds to one-day thousands of workstations. Where we can gather and analyze the usage data to create efficiencies and automation.
To make this possible, the application code should be instrumented with telemetry data for deep insights , includin g: . Metrics to find out how the behavior of a system has changed over time . Logs represent event data in plain-text, structured or binary format . OneAgent and its Operator .
We organize all of the trending information in your field so you don't have to. Join 5,000+ users and stay up to date on the latest articles your peers are reading.
You know about us, now we want to get to know you!
Let's personalize your content
Let's get even more personalized
We recognize your account from another site in our network, please click 'Send Email' below to continue with verifying your account and setting a password.


Let's personalize your content