This site uses cookies to improve your experience. To help us insure we adhere to various privacy regulations, please select your country/region of residence. If you do not select a country, we will assume you are from the United States. Select your Cookie Settings or view our Privacy Policy and Terms of Use.
Cookie Settings
Cookies and similar technologies are used on this website for proper function of the website, for tracking performance analytics and for marketing purposes. We and some of our third-party providers may use cookie data for various purposes. Please review the cookie settings below and choose your preference.
Used for the proper function of the website
Used for monitoring website traffic and interactions
Cookie Settings
Cookies and similar technologies are used on this website for proper function of the website, for tracking performance analytics and for marketing purposes. We and some of our third-party providers may use cookie data for various purposes. Please review the cookie settings below and choose your preference.
Strictly Necessary: Used for the proper function of the website
Performance/Analytics: Used for monitoring website traffic and interactions
The system design of an audio streaming app is unique in how it deals with idiosyncratic business needs. Typically, audio streaming requires a large amount of data to be transferred within the limited bandwidth of the network communication channel.
Key insights for executives: Increase operational efficiency with automation and AI to foster seamless collaboration : With AI and automated workflows, teams work from shared data, automate repetitive tasks, and accelerate resolutionfocusing more on business outcomes. No delays and overhead of reindexing and rehydration.
By Alok Tiagi , Hariharan Ananthakrishnan , Ivan Porto Carrero and Keerti Lakshminarayan Netflix has developed a network observability sidecar called Flow Exporter that uses eBPF tracepoints to capture TCP flows at near real time. Without having network visibility, it’s difficult to improve our reliability, security and capacity posture.
Multimodal data processing is the evolving need of the latest data platforms powering applications like recommendation systems, autonomous vehicles, and medical diagnostics. Handling multimodal data spanning text, images, videos, and sensor inputs requires resilient architecture to manage the diversity of formats and scale.
In the changing world of data centers and cloud computing, the desire for efficient, flexible, and scalable networking solutions has resulted in the broad use of Software-Defined Networking (SDN). Traditional networking models have a tightly integrated control plane and data plane within network devices.
DevOps and security teams managing today’s multicloud architectures and cloud-native applications are facing an avalanche of data. This has resulted in visibility gaps, siloed data, and negative effects on cross-team collaboration. At the same time, the number of individual observability and security tools has grown.
For cloud operations teams, network performance monitoring is central in ensuring application and infrastructure performance. If the network is sluggish, an application may also be slow, frustrating users. Worse, a malicious attacker may gain access to the network, compromising sensitive application data.
It can scale towards a multi-petabyte level data workload without a single issue, and it allows access to a cluster of powerful servers that will work together within a single SQL interface where you can view all of the data. This feature-packed database provides powerful and rapid analytics on data that scales up to petabyte volumes.
These releases often assumed ideal conditions such as zero latency, infinite bandwidth, and no network loss, as highlighted in Peter Deutsch’s eight fallacies of distributed systems. With Dynatrace, teams can seamlessly monitor the entire system, including network switches, database storage, and third-party dependencies.
In fact, this is really no different than the challenges that are inherit within a single on-premises data center implementation. Power outages and network issues are common examples of challenges that can put your service — and your business — at risk.
Cloud service providers (CSPs) share carbon footprint data with their customers, but the focus of these tools is on reporting and trending, effectively targeting sustainability officers and business leaders. This is partly due to the complexity of instrumenting and analyzing emissions across diverse cloud and on-premises infrastructures.
Combined with Dynatrace OneAgent ® , you gain a precise view of the status of your systems at a glance. Why browser and HTTP monitors might not be sufficient In modern IT environments, which are complex and dynamically changing, you often need deeper insights into the Transport or Network layers. But is this all you need?
You might have state-of-the-art surveillance systems and guards at the main entrance, but if a side door is left unlocked, all the security becomes meaningless. etcd database The etcd Database is the brain of your cluster, storing all configuration data that the API server uses to verify and maintain the cluster state.
Zabbix is a universal monitoring tool that combines data collection , data visualization , and problem notification. My first encounter with this monitoring system was in 2014 when I joined a project where Zabbix was already in use for monitoring network devices (routers, switches). Back then, it was version 2.2,
By Cheng Xie , Bryan Shultz , and Christine Xu In a previous blog post , we described how Netflix uses eBPF to capture TCP flow logs at scale for enhanced network insights. Delays and failures are inevitable in distributed systems, which may delay IP address change events from reaching FlowCollector.
EdgeConnect provides a secure bridge for SaaS-heavy companies like Dynatrace, which hosts numerous systems and data behind VPNs. EdgeConnect facilitates seamless interaction, ensuring data security and operational efficiency. EdgeConnect is designed to forward HTTP(s) requests exclusively, ensuring secure data transmission.
Welcome, data enthusiasts! Whether you’re a seasoned IT expert or a marketing professional looking to improve business performance, understanding the data available to you is essential. In this blog series, we’ll guide you through creating powerful dashboards that transform complex data into actionable insights.
Log management is an organization’s rules and policies for managing and enabling the creation, transmission, analysis, storage, and other tasks related to IT systems’ and applications’ log data. In cloud-native environments, there can also be dozens of additional services and functions all generating data from user-driven events.
However, your responsibilities might change or expand, and you need to work with unfamiliar data sets. Activate Davis AI to analyze charts within seconds Davis AI can help you expand your dashboards and dive deeper into your available data to extract additional information.
This is further exacerbated by the fact that a significant portion of their IT budgets are allocated to maintaining outdated legacy systems. By combining AI and observability, government agencies can create more intelligent and responsive systems that are better equipped to tackle the challenges of today and tomorrow.
Second, developers had to constantly re-learn new data modeling practices and common yet critical data access patterns. To overcome these challenges, we developed a holistic approach that builds upon our Data Gateway Platform. Data Model At its core, the KV abstraction is built around a two-level map architecture.
IT operations analytics is the process of unifying, storing, and contextually analyzing operational data to understand the health of applications, infrastructure, and environments and streamline everyday operations. ITOA collects operational data to identify patterns and anomalies for faster incident management and near-real-time insights.
Exploratory analytics now cover more bespoke scenarios, allowing you to access any element of test results stored in the Dynatrace Grail data lakehouse. But nowadays, with complex and dynamically changing modern IT systems, the last result details might not be enough in some cases.
The network latency between cluster nodes should be around 10 ms or less. With Dynatrace actively managing business-critical applications, some of our globally distributed enterprise customers require Dynatrace Managed to continue operating even when an entire data center goes down. Minimized cross-data center network traffic.
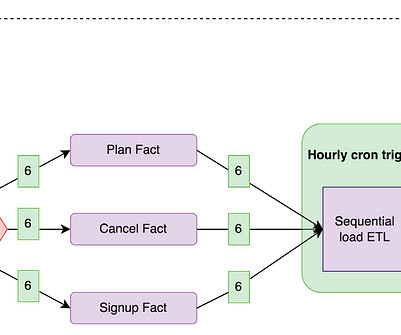
By Abhinaya Shetty , Bharath Mummadisetty At Netflix, our Membership and Finance Data Engineering team harnesses diverse data related to plans, pricing, membership life cycle, and revenue to fuel analytics, power various dashboards, and make data-informed decisions. We expect complete and accurate data at the end of each run.
In today’s data-driven world, businesses across various industry verticals increasingly leverage the Internet of Things (IoT) to drive efficiency and innovation. Both methods allow you to ingest and process raw data and metrics. The ADS-B protocol differs significantly from web technologies.
The nirvana state of system uptime at peak loads is known as “five-nines availability.” In its pursuit, IT teams hover over system performance dashboards hoping their preparations will deliver five nines—or even four nines—availability. How can IT teams deliver system availability under peak loads that will satisfy customers?
Log data provides a unique source of truth for debugging applications, optimizing infrastructure, and investigating security incidents. This contextualization of log data enables AI-powered problem detection and root cause analysis at scale. Dynamic landscape and data handling requirements result in manual work.
The attacker escapes the container boundary by exploiting the root privileges and gains access to the underlying host system. Lateral movement across the cluster With host access established, the attacker discovers that the cluster has no network policies defined. Misconfiguration. Exploitation of OpenMetadata Flaws.
In the world of distributed systems, few things are more frustrating to users than making a change and then not seeing it immediately. Try to change your status on your favorite social network site and reload the page only to discover your previous status.
Dynatrace and the Dynatrace Intelligent Observability Platform have added support for the newly introduced Amazon VPC Flow Logs to Amazon Kinesis Data Firehose. This support enables customers to define specific endpoint delivery of real-time streaming data to platforms such as Dynatrace. What is VPC Flow Logs? Why Dynatrace?
Scaling RabbitMQ ensures your system can handle growing traffic and maintain high performance. Youll also learn strategies for maintaining data safety and managing node failures so your RabbitMQ setup is always up to the task. This decoupling is crucial in modern architectures where scalability and fault tolerance are paramount.
Rajiv Shringi Vinay Chella Kaidan Fullerton Oleksii Tkachuk Joey Lynch Introduction As Netflix continues to expand and diversify into various sectors like Video on Demand and Gaming , the ability to ingest and store vast amounts of temporal data — often reaching petabytes — with millisecond access latency has become increasingly vital.
In the connected world of today, accurate timekeeping has become essential for many functions of contemporary computing and communication systems. Accurate time is crucial for all financial transactions, data synchronization, network security, and even just making sure that devices around the world are in sync.
The massive volumes of log data associated with a breach have made cybersecurity forensics a complicated, costly problem to solve. As organizations adopt more cloud-native technologies, observability data—telemetry from applications and infrastructure, including logs, metrics, and traces—and security data are converging.
In a digital-first world, site reliability engineers and IT data analysts face numerous challenges with data quality and reliability in their quest for cloud control. Increasingly, organizations seek to address these problems using AI techniques as part of their exploratory data analytics practices.
OpenTelemetry , the open source observability tool, has become the go-to standard for instrumenting custom applications to collect observability telemetry data. For this third and final part of our series, we saved the best for last: How you can enhance telemetry data even more and with less effort on your end with Dynatrace OneAgent.
Analytics Engineers deliver these insights by establishing deep business and product partnerships; translating business challenges into solutions that unblock critical decisions; and designing, building, and maintaining end-to-end analytical systems. Wed love to see DJ easing your metric creation and consumption painpoints!
This can include internal services within an organizations infrastructure or external systems. SSRF can lead to unauthorized access to sensitive data, such as cloud metadata, internal databases, and other protected resources. Attackers can exploit SSRF to bypass firewalls, steal credentials, and execute arbitrary commands.
They may stem from software bugs, cyberattacks, surges in demand, issues with backup processes, network problems, or human errors. Cyberattack Cyberattacks involve malicious activities aimed at disrupting services, stealing data, or causing damage. Let’s explore each of these elements and what organizations can do to avoid them.
Welcome back to our power dashboarding blog series , data enthusiasts! Query your data with natural language Davis CoPilot is an excellent virtual assistant that helps you create queries using natural language. exploring your data when you know your desired outcome but are unfamiliar with the available data. Select Run.
Any service provider tries to reach several metrics in their activity. One group of these metrics is service quality. Quality metrics contain: The ratio of successfully processed requests. Distribution of processing time between requests. Number of requests dependent curves.
Apache Spark is an open-source distributed computing system designed for large-scale data processing. RDDs are an abstraction of a distributed collection of data that can be processed in parallel across a cluster of machines. What Is Apache Spark?
RabbitMQ is designed for flexible routing and message reliability, while Kafka handles high-throughput event streaming and real-time data processing. Both serve distinct purposes, from managing message queues to ingesting large data volumes.
We organize all of the trending information in your field so you don't have to. Join 5,000+ users and stay up to date on the latest articles your peers are reading.
You know about us, now we want to get to know you!
Let's personalize your content
Let's get even more personalized
We recognize your account from another site in our network, please click 'Send Email' below to continue with verifying your account and setting a password.


Let's personalize your content