This site uses cookies to improve your experience. To help us insure we adhere to various privacy regulations, please select your country/region of residence. If you do not select a country, we will assume you are from the United States. Select your Cookie Settings or view our Privacy Policy and Terms of Use.
Cookie Settings
Cookies and similar technologies are used on this website for proper function of the website, for tracking performance analytics and for marketing purposes. We and some of our third-party providers may use cookie data for various purposes. Please review the cookie settings below and choose your preference.
Used for the proper function of the website
Used for monitoring website traffic and interactions
Cookie Settings
Cookies and similar technologies are used on this website for proper function of the website, for tracking performance analytics and for marketing purposes. We and some of our third-party providers may use cookie data for various purposes. Please review the cookie settings below and choose your preference.
Strictly Necessary: Used for the proper function of the website
Performance/Analytics: Used for monitoring website traffic and interactions
When we launched the new Dynatrace experience, we introduced major updates to the platform, including Grail ™, our innovative data lakehouse unifying observability, security, and business data, and Dynatrace Query Language ( DQL ) for accessing and exploring unified data.
Multimodal dataprocessing is the evolving need of the latest data platforms powering applications like recommendation systems, autonomous vehicles, and medical diagnostics. Handling multimodal data spanning text, images, videos, and sensor inputs requires resilient architecture to manage the diversity of formats and scale.
By Alok Tiagi , Hariharan Ananthakrishnan , Ivan Porto Carrero and Keerti Lakshminarayan Netflix has developed a network observability sidecar called Flow Exporter that uses eBPF tracepoints to capture TCP flows at near real time. Without having network visibility, it’s difficult to improve our reliability, security and capacity posture.
Managing SNMP devices at scale can be challenging SNMP (Simple Network Management Protocol) provides a standardized framework for monitoring and managing devices on IP networks. Its simplicity, scalability, and compatibility with a wide range of hardware make it an ideal choice for network management across diverse environments.
In today’s digital landscape, ensuring payment card data security is paramount. These standards protect card information during and after financial transactions by ensuring that the transactions are processed in a secure environment.
This, of course, is exacerbated by the new Vitals announcement, whereby data from the Chrome User eXperience Report will be used to aid and influence rankings. The data is static which isn’t necessarily a drawback until it is—DevTools allows us to work far more quickly and interactively, responding to changes and tweaks as we make them.
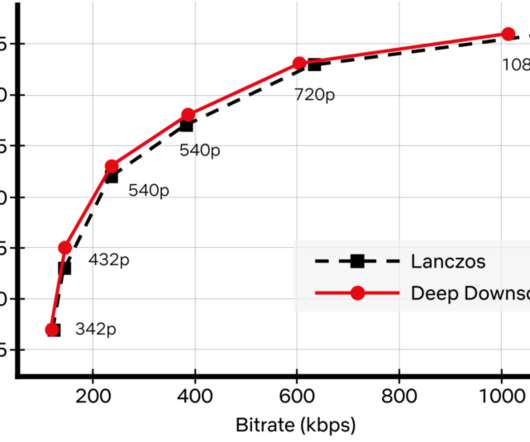
Recently, we added another powerful tool to our arsenal: neural networks for video downscaling. In this tech blog, we describe how we improved Netflix video quality with neural networks, the challenges we faced and what lies ahead. How can neural networks fit into Netflix video encoding?
Greenplum Database is a massively parallel processing (MPP) SQL database that is built and based on PostgreSQL. It can scale towards a multi-petabyte level data workload without a single issue, and it allows access to a cluster of powerful servers that will work together within a single SQL interface where you can view all of the data.
Ensuring smooth operations is no small feat, whether you’re in charge of application performance, IT infrastructure, or business processes. However, your responsibilities might change or expand, and you need to work with unfamiliar data sets. Your trained eye can interpret them at a glance, a skill that sets you apart.
Cloud service providers (CSPs) share carbon footprint data with their customers, but the focus of these tools is on reporting and trending, effectively targeting sustainability officers and business leaders. Actions resulting from the evaluation The certification process surfaced a few recommendations for improving the app.
For cloud operations teams, network performance monitoring is central in ensuring application and infrastructure performance. If the network is sluggish, an application may also be slow, frustrating users. Worse, a malicious attacker may gain access to the network, compromising sensitive application data.
Complexity and data volume for IT infrastructure soars to new heights. The volume of data and events grows in tandem with the rising complexity of IT infrastructure. Monitoring modern IT infrastructure is difficult, sometimes impossible, without advanced network monitoring tools. How SNMP traps help detect problems.
Why browser and HTTP monitors might not be sufficient In modern IT environments, which are complex and dynamically changing, you often need deeper insights into the Transport or Network layers. Is it a bug in the codebase, a malfunctioning backend service, an overloaded hosting infrastructure, or perhaps a misconfigured network?
Key insights for executives: Increase operational efficiency with automation and AI to foster seamless collaboration : With AI and automated workflows, teams work from shared data, automate repetitive tasks, and accelerate resolutionfocusing more on business outcomes. No delays and overhead of reindexing and rehydration.
By Cheng Xie , Bryan Shultz , and Christine Xu In a previous blog post , we described how Netflix uses eBPF to capture TCP flow logs at scale for enhanced network insights. Misattribution rendered the flow data unreliable for decision-making. 2xlarge instances, we can process 5 million flows per second across the entire Netflixfleet.
With the evolution of modern applications serving increasing needs for real-time dataprocessing and retrieval, scalability does, too. One such open-source, distributed search and analytics engine is Elasticsearch, which is very efficient at handling data in large sets and high-velocity queries.
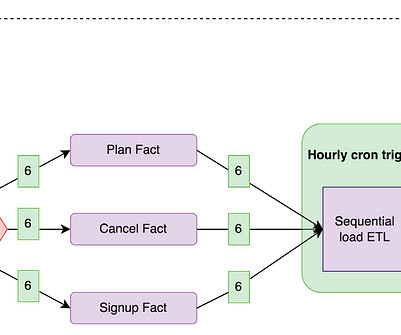
By Abhinaya Shetty , Bharath Mummadisetty At Netflix, our Membership and Finance Data Engineering team harnesses diverse data related to plans, pricing, membership life cycle, and revenue to fuel analytics, power various dashboards, and make data-informed decisions. We expect complete and accurate data at the end of each run.
IT operations analytics is the process of unifying, storing, and contextually analyzing operational data to understand the health of applications, infrastructure, and environments and streamline everyday operations. ITOA automates repetitive cloud operations tasks and streamlines the flow of analytics into decision-making processes.
Log data provides a unique source of truth for debugging applications, optimizing infrastructure, and investigating security incidents. This contextualization of log data enables AI-powered problem detection and root cause analysis at scale. Dynamic landscape and data handling requirements result in manual work.
Future blogs will provide deeper dives into each service, sharing insights and lessons learned from this process. The Netflix video processing pipeline went live with the launch of our streaming service in 2007. The Netflix video processing pipeline went live with the launch of our streaming service in 2007.
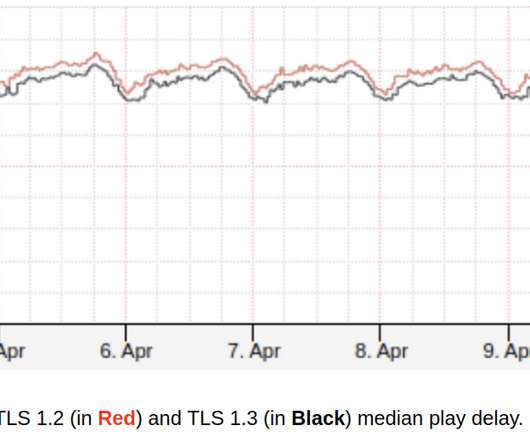
How Netflix brings safer and faster streaming experience to the living room on crowded networks using TLS 1.3 We want playback to start instantly and to never stop unexpectedly in any network environment. Confidentiality: Data sent over the channel is only visible to the endpoints. Authenticated Encryption For encryption, TLS 1.3
Second, developers had to constantly re-learn new data modeling practices and common yet critical data access patterns. To overcome these challenges, we developed a holistic approach that builds upon our Data Gateway Platform. Data Model At its core, the KV abstraction is built around a two-level map architecture.
In today’s complex IT environments, the sheer volume of data created makes it impossible for humans to monitor, comprehend, or troubleshoot problems before they impact the experience of your end users. Still, you might have use cases that rely on important custom data streams. Now you can: Alert on the outage of a custom data source.
In today’s data-driven world, businesses across various industry verticals increasingly leverage the Internet of Things (IoT) to drive efficiency and innovation. Both methods allow you to ingest and process raw data and metrics. The ADS-B protocol differs significantly from web technologies.
Try to change your status on your favorite social network site and reload the page only to discover your previous status. Read Your Own Writes consistency is an assurance that once a process, usually a user, has updated a piece of data, all subsequent reads by that same process will return the updated value.
The network latency between cluster nodes should be around 10 ms or less. With Dynatrace actively managing business-critical applications, some of our globally distributed enterprise customers require Dynatrace Managed to continue operating even when an entire data center goes down. Minimized cross-data center network traffic.
This is the ability to see into and measure the current state of a system based on the data it generates, which typically includes logs, metrics, traces, end-user experiences, and context across cloud, multi-cloud, and hybrid environments. This blog originally appeared in Federal News Network. First, let’s discuss observability.
Dynatrace and the Dynatrace Intelligent Observability Platform have added support for the newly introduced Amazon VPC Flow Logs to Amazon Kinesis Data Firehose. This support enables customers to define specific endpoint delivery of real-time streaming data to platforms such as Dynatrace. What is VPC Flow Logs? Why Dynatrace?
Log data—the most verbose form of observability data, complementing other standardized signals like metrics and traces—is especially critical. As cloud complexity grows, it brings more volume, velocity, and variety of log data. When trying to address this challenge, your cloud architects will likely choose Amazon Data Firehose.
Metric definitions are often scattered across various databases, documentation sites, and code repositories, making it difficult for analysts and data scientists to find reliable information quickly. LORE: How were democratizing analytics atNetflix Apurva Kansara At Netflix, we rely on data and analytics to inform critical business decisions.
Quality metrics contain: The ratio of successfully processed requests. Distribution of processing time between requests. Any service provider tries to reach several metrics in their activity. One group of these metrics is service quality. Number of requests dependent curves.
In a digital-first world, site reliability engineers and IT data analysts face numerous challenges with data quality and reliability in their quest for cloud control. Increasingly, organizations seek to address these problems using AI techniques as part of their exploratory data analytics practices.
Youll also learn strategies for maintaining data safety and managing node failures so your RabbitMQ setup is always up to the task. Implementing clustering and quorum queues in RabbitMQ significantly improves load distribution and data redundancy, ensuring high availability and fault tolerance for messaging services.
The massive volumes of log data associated with a breach have made cybersecurity forensics a complicated, costly problem to solve. As organizations adopt more cloud-native technologies, observability data—telemetry from applications and infrastructure, including logs, metrics, and traces—and security data are converging.
OpenTelemetry , the open source observability tool, has become the go-to standard for instrumenting custom applications to collect observability telemetry data. For this third and final part of our series, we saved the best for last: How you can enhance telemetry data even more and with less effort on your end with Dynatrace OneAgent.
Rajiv Shringi Vinay Chella Kaidan Fullerton Oleksii Tkachuk Joey Lynch Introduction As Netflix continues to expand and diversify into various sectors like Video on Demand and Gaming , the ability to ingest and store vast amounts of temporal data — often reaching petabytes — with millisecond access latency has become increasingly vital.
Apache Spark is an open-source distributed computing system designed for large-scale dataprocessing. Spark provides a unified framework for processing and analyzing large datasets across distributed computing clusters.
It’s also critical to have a strategy in place to address these outages, including both documented remediation processes and an observability platform to help you proactively identify and resolve issues to minimize customer and business impact. This can result from improperly configured backups, corrupted data, or insufficient testing.
from a client it performs two parallel operations: i) persisting the action in the data store ii) publish the action in a streaming data store for a pub-sub model. User Feed Service, Media Counter Service) read the actions from the streaming data store and performs their specific tasks. After that, the various services (e.g.
RabbitMQ is designed for flexible routing and message reliability, while Kafka handles high-throughput event streaming and real-time dataprocessing. Both serve distinct purposes, from managing message queues to ingesting large data volumes. What is Apache Kafka?
The data produced on set is traditionally copied to physical tape stock like LTO. A lack of automation and standardization often results in a labour-intensive process across post-production and VFX with a lot of dependencies that introduce potential human errors and security risks.
Additional benefits of Dynatrace SaaS on Azure include: No infrastructure investment : Dynatrace manages the infrastructure for you, including automatic visibility, problem detection, and smart alerting across virtual networks, virtual infrastructure, and container orchestration.
This year’s conference agenda was packed full of choices, including: Keynotes : Topics included accelerating digital transformation, with Dynatrace CIO Mike Maciag, and Spatial Collapse: The Great Acceleration of Turning Data Into an Asset, with Tricia Wang from Sudden Compass. We’ve all heard it: data is one of your biggest assets.
Understanding that the first mile of getting data in can often be the hardest, Dynatrace continues to invest in log ingest, offering a range of out-of-the-box solutions within the Dynatrace Platform and apps. Native support for syslog messages extends our infrastructure log support to all Linux/Unix systems and network devices.
We organize all of the trending information in your field so you don't have to. Join 5,000+ users and stay up to date on the latest articles your peers are reading.
You know about us, now we want to get to know you!
Let's personalize your content
Let's get even more personalized
We recognize your account from another site in our network, please click 'Send Email' below to continue with verifying your account and setting a password.


Let's personalize your content