This site uses cookies to improve your experience. To help us insure we adhere to various privacy regulations, please select your country/region of residence. If you do not select a country, we will assume you are from the United States. Select your Cookie Settings or view our Privacy Policy and Terms of Use.
Cookie Settings
Cookies and similar technologies are used on this website for proper function of the website, for tracking performance analytics and for marketing purposes. We and some of our third-party providers may use cookie data for various purposes. Please review the cookie settings below and choose your preference.
Used for the proper function of the website
Used for monitoring website traffic and interactions
Cookie Settings
Cookies and similar technologies are used on this website for proper function of the website, for tracking performance analytics and for marketing purposes. We and some of our third-party providers may use cookie data for various purposes. Please review the cookie settings below and choose your preference.
Strictly Necessary: Used for the proper function of the website
Performance/Analytics: Used for monitoring website traffic and interactions
When we launched the new Dynatrace experience, we introduced major updates to the platform, including Grail ™, our innovative data lakehouse unifying observability, security, and business data, and Dynatrace Query Language ( DQL ) for accessing and exploring unified data.
Some are discouraged by the complexity of TCP/IP networking literature, while others are misled by confusing details in Wireshark. For instance, a DBA facing performance problems might misinterpret packet capture data in Wireshark, erroneously concluding that TCP retransmissions are the cause.
By Alok Tiagi , Hariharan Ananthakrishnan , Ivan Porto Carrero and Keerti Lakshminarayan Netflix has developed a network observability sidecar called Flow Exporter that uses eBPF tracepoints to capture TCP flows at near real time. Without having network visibility, it’s difficult to improve our reliability, security and capacity posture.
Expectations for network monitoring In today’s digital landscape, businesses rely heavily on their IT infrastructure to deliver seamless services to customers. However, network issues can lead to significant downtime, affecting user experience and business operations. For more details, please refer to Dynatrace Documentation.
This, of course, is exacerbated by the new Vitals announcement, whereby data from the Chrome User eXperience Report will be used to aid and influence rankings. The data is static which isn’t necessarily a drawback until it is—DevTools allows us to work far more quickly and interactively, responding to changes and tweaks as we make them.
Managing SNMP devices at scale can be challenging SNMP (Simple Network Management Protocol) provides a standardized framework for monitoring and managing devices on IP networks. Its simplicity, scalability, and compatibility with a wide range of hardware make it an ideal choice for network management across diverse environments.
Multimodal data processing is the evolving need of the latest data platforms powering applications like recommendation systems, autonomous vehicles, and medical diagnostics. Handling multimodal data spanning text, images, videos, and sensor inputs requires resilient architecture to manage the diversity of formats and scale.
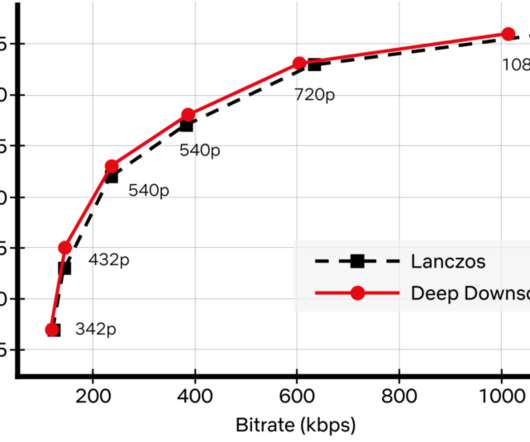
Recently, we added another powerful tool to our arsenal: neural networks for video downscaling. In this tech blog, we describe how we improved Netflix video quality with neural networks, the challenges we faced and what lies ahead. How can neural networks fit into Netflix video encoding?
You can use it to track loading times, optimize CSS and JavaScript , and inspect network activity. But there’s an important piece of performance data that DevTools doesn’t yet expose by default: Long Animation Frames (LoAFs).
In today’s digital landscape, ensuring payment card data security is paramount. The PCI DSS framework includes maintaining a secure network, implementing strong access control measures, and regularly monitoring and testing networks. What is PCI DSS?
For cloud operations teams, network performance monitoring is central in ensuring application and infrastructure performance. If the network is sluggish, an application may also be slow, frustrating users. Worse, a malicious attacker may gain access to the network, compromising sensitive application data.
Quick and easy network infrastructure monitoring. Would you like to access all your monitoring data on a single platform? Dynatrace has you covered—Dynatrace extensions collect the necessary data and offer improved visibility wherever you need a single platform for IM and APM purposes. Start monitoring in minutes. Interfaces.
Cloud service providers (CSPs) share carbon footprint data with their customers, but the focus of these tools is on reporting and trending, effectively targeting sustainability officers and business leaders. Power usage effectiveness (PUE) is derived from data provided by the cloud providers and data center operators.
What Is Network Sniffing? Sniffing includes the passive interception of data packets crossing a network with further analysis. Initially, sniffing was developed to help network administrators troubleshoot connectivity problems, and since then, it has evolved into an important technique of network management and security testing.
Why browser and HTTP monitors might not be sufficient In modern IT environments, which are complex and dynamically changing, you often need deeper insights into the Transport or Network layers. Is it a bug in the codebase, a malfunctioning backend service, an overloaded hosting infrastructure, or perhaps a misconfigured network?
It can scale towards a multi-petabyte level data workload without a single issue, and it allows access to a cluster of powerful servers that will work together within a single SQL interface where you can view all of the data. This feature-packed database provides powerful and rapid analytics on data that scales up to petabyte volumes.
Complexity and data volume for IT infrastructure soars to new heights. The volume of data and events grows in tandem with the rising complexity of IT infrastructure. Monitoring modern IT infrastructure is difficult, sometimes impossible, without advanced network monitoring tools. How SNMP traps help detect problems.
In the changing world of data centers and cloud computing, the desire for efficient, flexible, and scalable networking solutions has resulted in the broad use of Software-Defined Networking (SDN). Traditional networking models have a tightly integrated control plane and data plane within network devices.
In today’s complex IT environments, the sheer volume of data created makes it impossible for humans to monitor, comprehend, or troubleshoot problems before they impact the experience of your end users. Still, you might have use cases that rely on important custom data streams. Now you can: Alert on the outage of a custom data source.
DevOps and security teams managing today’s multicloud architectures and cloud-native applications are facing an avalanche of data. This has resulted in visibility gaps, siloed data, and negative effects on cross-team collaboration. At the same time, the number of individual observability and security tools has grown.
Welcome, data enthusiasts! Whether you’re a seasoned IT expert or a marketing professional looking to improve business performance, understanding the data available to you is essential. In this blog series, we’ll guide you through creating powerful dashboards that transform complex data into actionable insights.
This is the ability to see into and measure the current state of a system based on the data it generates, which typically includes logs, metrics, traces, end-user experiences, and context across cloud, multi-cloud, and hybrid environments. This blog originally appeared in Federal News Network. First, let’s discuss observability.
Log data provides a unique source of truth for debugging applications, optimizing infrastructure, and investigating security incidents. This contextualization of log data enables AI-powered problem detection and root cause analysis at scale. Dynamic landscape and data handling requirements result in manual work.
Second, developers had to constantly re-learn new data modeling practices and common yet critical data access patterns. To overcome these challenges, we developed a holistic approach that builds upon our Data Gateway Platform. Data Model At its core, the KV abstraction is built around a two-level map architecture.
However, your responsibilities might change or expand, and you need to work with unfamiliar data sets. Activate Davis AI to analyze charts within seconds Davis AI can help you expand your dashboards and dive deeper into your available data to extract additional information.
IT operations analytics is the process of unifying, storing, and contextually analyzing operational data to understand the health of applications, infrastructure, and environments and streamline everyday operations. ITOA collects operational data to identify patterns and anomalies for faster incident management and near-real-time insights.
In today’s data-driven world, businesses across various industry verticals increasingly leverage the Internet of Things (IoT) to drive efficiency and innovation. Both methods allow you to ingest and process raw data and metrics. The ADS-B protocol differs significantly from web technologies.
Dynatrace and the Dynatrace Intelligent Observability Platform have added support for the newly introduced Amazon VPC Flow Logs to Amazon Kinesis Data Firehose. This support enables customers to define specific endpoint delivery of real-time streaming data to platforms such as Dynatrace. What is VPC Flow Logs? Why Dynatrace?
In today's interconnected world, computer networks have become the backbone of modern communication and information exchange. They enable the seamless transmission of data, facilitate collaboration, and connect individuals and devices across the globe.
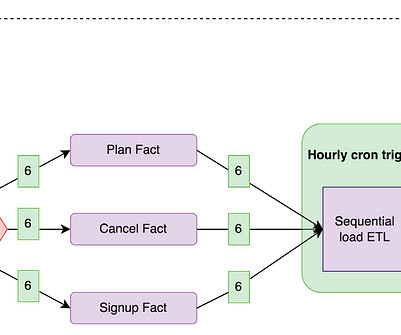
By Abhinaya Shetty , Bharath Mummadisetty At Netflix, our Membership and Finance Data Engineering team harnesses diverse data related to plans, pricing, membership life cycle, and revenue to fuel analytics, power various dashboards, and make data-informed decisions. We expect complete and accurate data at the end of each run.
Log data—the most verbose form of observability data, complementing other standardized signals like metrics and traces—is especially critical. As cloud complexity grows, it brings more volume, velocity, and variety of log data. When trying to address this challenge, your cloud architects will likely choose Amazon Data Firehose.
Exploratory analytics now cover more bespoke scenarios, allowing you to access any element of test results stored in the Dynatrace Grail data lakehouse. It now fully supports not only Network Availability Monitors but also HTTP synthetic monitors. The new Dynatrace Synthetic app allows you to analyze these results.
In a digital-first world, site reliability engineers and IT data analysts face numerous challenges with data quality and reliability in their quest for cloud control. Increasingly, organizations seek to address these problems using AI techniques as part of their exploratory data analytics practices.
Traditional statistical methods like ARIMA and exponential smoothing have served us well but have limitations in capturing complex non-linear relationships in data. This is where Recurrent Neural Networks (RNNs) offer an edge, providing a powerful tool for modeling complex time-dependent phenomena.
Rajiv Shringi Vinay Chella Kaidan Fullerton Oleksii Tkachuk Joey Lynch Introduction As Netflix continues to expand and diversify into various sectors like Video on Demand and Gaming , the ability to ingest and store vast amounts of temporal data — often reaching petabytes — with millisecond access latency has become increasingly vital.
Accurate time is crucial for all financial transactions, data synchronization, network security, and even just making sure that devices around the world are in sync. NTP servers, which manage the Network Time Protocol, are essential in achieving this.
With the evolution of modern applications serving increasing needs for real-time data processing and retrieval, scalability does, too. One such open-source, distributed search and analytics engine is Elasticsearch, which is very efficient at handling data in large sets and high-velocity queries.
With the constant evolution of this sector, the dynamic duo of AI and ML is revolutionizing the telecommunications industry, propelling it towards greater network efficiency, unparalleled customer service, and fortified security measures. Here's an example of how machine learning can optimize network performance:
Any service provider tries to reach several metrics in their activity. One group of these metrics is service quality. Quality metrics contain: The ratio of successfully processed requests. Distribution of processing time between requests. Number of requests dependent curves.
The massive volumes of log data associated with a breach have made cybersecurity forensics a complicated, costly problem to solve. As organizations adopt more cloud-native technologies, observability data—telemetry from applications and infrastructure, including logs, metrics, and traces—and security data are converging.
Try to change your status on your favorite social network site and reload the page only to discover your previous status. Read Your Own Writes consistency is an assurance that once a process, usually a user, has updated a piece of data, all subsequent reads by that same process will return the updated value.
OpenTelemetry , the open source observability tool, has become the go-to standard for instrumenting custom applications to collect observability telemetry data. For this third and final part of our series, we saved the best for last: How you can enhance telemetry data even more and with less effort on your end with Dynatrace OneAgent.
What Are Virtual Network Functions (VNFs)? In IBM Cloud, we have proprietary hardware like the FortiGate firewall that resides inside IBM Cloud data centers today. VNFs are virtualized network services that are packaged as virtual machines (VMs) on commodity hardware.
Apache Spark is an open-source distributed computing system designed for large-scale data processing. RDDs are an abstraction of a distributed collection of data that can be processed in parallel across a cluster of machines. What Is Apache Spark?
We organize all of the trending information in your field so you don't have to. Join 5,000+ users and stay up to date on the latest articles your peers are reading.
You know about us, now we want to get to know you!
Let's personalize your content
Let's get even more personalized
We recognize your account from another site in our network, please click 'Send Email' below to continue with verifying your account and setting a password.


Let's personalize your content