This site uses cookies to improve your experience. To help us insure we adhere to various privacy regulations, please select your country/region of residence. If you do not select a country, we will assume you are from the United States. Select your Cookie Settings or view our Privacy Policy and Terms of Use.
Cookie Settings
Cookies and similar technologies are used on this website for proper function of the website, for tracking performance analytics and for marketing purposes. We and some of our third-party providers may use cookie data for various purposes. Please review the cookie settings below and choose your preference.
Used for the proper function of the website
Used for monitoring website traffic and interactions
Cookie Settings
Cookies and similar technologies are used on this website for proper function of the website, for tracking performance analytics and for marketing purposes. We and some of our third-party providers may use cookie data for various purposes. Please review the cookie settings below and choose your preference.
Strictly Necessary: Used for the proper function of the website
Performance/Analytics: Used for monitoring website traffic and interactions
There’s a goldmine of business data traversing your IT systems, yet most of it remains untapped. To unlock business value, the data must be: Accessible from anywhere. Data has value only when you can access it, no matter where it lies. Agile business decisions rely on fresh data. Easy to access. Contextualized.
Let’s explore some of the advantages of monitoring GitHub runners using Dynatrace. By integrating Dynatrace with GitHub Actions, you can proactively monitor for potential issues or slowdowns in the deployment processes. Extending this visibility into your CI/CD pipelines offers even greater value.
When we launched the new Dynatrace experience, we introduced major updates to the platform, including Grail ™, our innovative data lakehouse unifying observability, security, and business data, and Dynatrace Query Language ( DQL ) for accessing and exploring unified data.
Take your monitoring, data exploration, and storytelling to the next level with outstanding data visualization All your applications and underlying infrastructure produce vast volumes of data that you need to monitor or analyze for insights.
To provide maximum freedom in selecting the service-level indicators that matter most to your business, Dynatrace combines SLOs with the power of Dynatrace Grail™ data lakehouse, the central data platform with heterogeneous and contextually linked data. This is where Grail, the Dynatrace central data platform, excels.
Exploratory analytics now cover more bespoke scenarios, allowing you to access any element of test results stored in the Dynatrace Grail data lakehouse. Analyzing the delivered payload (response body), response headers, or even details of requests sent during the monitors execution is invaluable when analyzing the failures root cause.
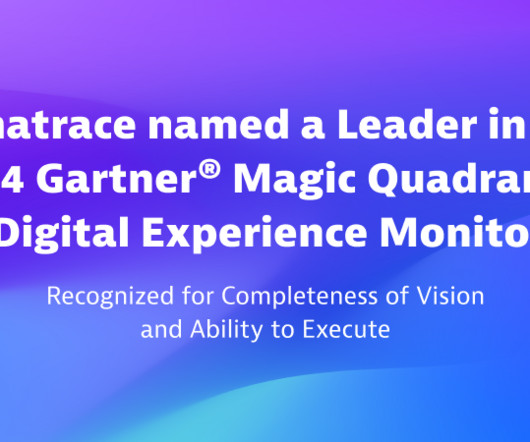
We’re excited to announce that Dynatrace has been named a Leader in the inaugural 2024 Gartner® Magic Quadrant™ for Digital Experience Monitoring. Dynatrace digital experience monitoring (DEM) monitors and analyzes the quality of digital experiences for users across digital channels by collecting data from multiple sources.
In this blog post, we’ll walk you through a hands-on demo that showcases how the Distributed Tracing app transforms raw OpenTelemetry data into actionable insights Set up the Demo To run this demo yourself, you’ll need the following: A Dynatrace tenant. If you don’t have one, you can use a trial account.
With an increasing number of regulations and standards governing how businesses handle data, an end-to-end compliance strategy is crucial. As the volume and complexity of data increase, understanding and managing logs effectively to reach compliance is essential. These logs contain sensitive healthcare data.
Fast and efficient log analysis is critical in todays data-driven IT environments. Dynatrace segments simplify and streamline data organization in large and complex IT environments, providing pre-scoped data without compromising performance. The dev-staging cluster isnt monitored regularly or included in an existing segment.
It packages the existing Dynatrace capabilities needed by developers in their day-to-day worksuch as logs, distributed traces, profiling data, exceptions, and more. Dashboards are a great tool for gaining real-time insights into applications by transforming complex data into dynamic, interactive visualizations.
Horizontally scalable data stores like Elasticsearch , Cassandra , and CockroachDB distribute their data across multiple nodes using techniques like consistent hashing. As nodes are added or removed, the data is reshuffled to ensure that the load is spread evenly across the new set of nodes.
To understand whats happening in todays complex software ecosystems, you need comprehensive telemetry data to make it all observable. With so many types of technologies in software stacks around the globe, OpenTelemetry has emerged as the de facto standard for gathering telemetry data. But, generating telemetry data is the easy part.
However, the challenge often lies in the fragmentation of vulnerability data across different systems and tools. The integration of Dynatrace with Tenable Vulnerability Management and the Tenable One platform brings a comprehensive approach to vulnerability management and user activity monitoring.
DevOps and security teams managing today’s multicloud architectures and cloud-native applications are facing an avalanche of data. On average, organizations use 10 different tools to monitor applications, infrastructure, and user experiences across these environments.
Recently, we’ve expanded our digital experience monitoring to cover the entire customer journey, from conversion to fulfillment. Key insights for executives: Optimize customer experiences through end-to-end contextual analytics from observability, user behavior, and business data.
Expectations for network monitoring In today’s digital landscape, businesses rely heavily on their IT infrastructure to deliver seamless services to customers. Traditional monitoring tools often fall short of providing deep insights into network layers, leaving gaps in understanding the root causes of performance issues.
More organizations are adopting the OpenTelemetry observability standard in pursuit of a vendor-neutral solution to manual instrumentation, sending data to multiple vendors, and gaining insight into third-party services. This will be used by the OpenTelemetry collector to send data to your Dynatrace tenant.
Digital experience monitoring (DEM) is crucial for organizations to meet this demand and succeed in today’s competitive digital economy. DEM solutions monitor and analyze the quality of digital experiences for users across digital channels. The time taken to complete the page load.
ABAC has several advantages: Enhanced security , providing granular control over access permissions, significantly reducing the risk of data breaches and unauthorized activities. High granularity by segmenting resource and record-level data, ensuring that access decisions are precise and context-aware.
You’re gathering a lot of data, but you can’t make sense of it. A histogram is a specific type of metric that allows users to understand the distribution of data points over a period of time. Histograms are commonly used to define and monitor service-level objectives (SLOs).
However, your responsibilities might change or expand, and you need to work with unfamiliar data sets. Activate Davis AI to analyze charts within seconds Davis AI can help you expand your dashboards and dive deeper into your available data to extract additional information.
In today’s digital landscape, ensuring payment card data security is paramount. The PCI DSS framework includes maintaining a secure network, implementing strong access control measures, and regularly monitoring and testing networks. What is PCI DSS?
Welcome, data enthusiasts! Whether you’re a seasoned IT expert or a marketing professional looking to improve business performance, understanding the data available to you is essential. In this blog series, we’ll guide you through creating powerful dashboards that transform complex data into actionable insights.
Zabbix is a universal monitoring tool that combines data collection , data visualization , and problem notification. My first encounter with this monitoring system was in 2014 when I joined a project where Zabbix was already in use for monitoring network devices (routers, switches).
We are in the era of data explosion, hybrid and multicloud complexities, and AI growth. Dynatrace analyzes billions of interconnected data points to deliver answers, not just data and dashboards sending signals without a path to resolution. Picture gaining insights into your business from the perspective of your users.
In fact, according to a Dynatrace global survey of 1,300 CIOs , 99% of enterprises utilize a multicloud environment and seven cloud monitoring solutions on average. What is cloud monitoring? Cloud monitoring is a set of solutions and practices used to observe, measure, analyze, and manage the health of cloud-based IT infrastructure.
Monitoring and observability are two key concepts that facilitate this process, offering valuable visibility into the health and performance of systems. In this article, we will explore the differences between monitoring and observability, provide examples to illustrate their applications and highlight their respective benefits.
With the pace of digital transformation continuing to accelerate, organizations are realizing the growing imperative to have a robust application security monitoring process in place. What are the goals of continuous application security monitoring and why is it important?
by Jasmine Omeke , Obi-Ike Nwoke , Olek Gorajek Intro This post is for all data practitioners, who are interested in learning about bootstrapping, standardization and automation of batch data pipelines at Netflix. You may remember Dataflow from the post we wrote last year titled Data pipeline asset management with Dataflow.
Through this integration, Dynatrace enriches data collected by Microsoft Sentinel to provide organizations with enhanced data insights in context of their full technology stack. In Microsoft Sentinel, security teams benefit from all the signals Dynatrace Davis® AI automatically generates without unsustainable, manual effort.
We’re excited to announce the release of Percona Monitoring and Management (PMM) 3.0.0 The Percona Monitoring and Management (PMM) 3.0.0 Notable security improvements include rootless deployments and encryption of sensitive data, along with improved API authentication using Grafana service accounts.
The effectiveness of this automation relies on the quality of the underlying data. Synthetic monitoring enhances observability by enabling proactive testing and monitoring systems to identify potential issues before they quickly impact users. This is why we integrated Dynatrace Synthetic Monitoring into Workflows.
Current synthetic capabilities Dynatrace Synthetic Monitoring is a powerful tool that provides insight into the health of your applications around the clock and as they’re perceived by your end users worldwide. Compared to other solutions I have tested, Dynatrace NAM monitors are the most configurable which is to my liking.
Monitoring business processes is one thing organizations can do to help improve the key business processes that enable them to provide great customer experiences. Business process monitoring refers to continuously tracking and analyzing key performance indicators (KPIs) from relevant process milestones. Reduce costs.
These enhancements enable you to extract more value from your data, leading to wider adoption across enterprise departments. This granular level of transparency helps identify cost drivers, monitor usage patterns, and uncover opportunities for cost savings. Figure 4: Set up an anomaly detector for peak cost events.
Cloud-native technologies are driving the need for organizations to adopt a more sophisticated IT monitoring approach to satisfy the competitive demands of modern business. Seeking insights from data Every organization depends on data to make decisions. Business observability is emerging as the answer.
For SREs, this means better proactive monitoring, fewer database-related incidents, and greater stability in production environments. A shared vision At Dynatrace, weve built a comprehensive observability platform that already includes deep database visibility, the Top Database Statements view, and Grail for unified data storage and analysis.
As these systems become more complex handling sensitive data, supporting real-time queries, and interfacing with multiple services being able to trace and measure each step of the data flow and inference process becomes critical.
In today’s data-driven world, businesses across various industry verticals increasingly leverage the Internet of Things (IoT) to drive efficiency and innovation. Mining and public transportation organizations commonly rely on IoT to monitor vehicle status and performance and ensure fuel efficiency and operational safety.
Observing complex environments involves handling regulatory, compliance, and data governance requirements. This continuously evolving landscape requires careful management and clarity regarding how sensitive data is used. This is particularly important when dealing with large volumes of data.
Additionally, certain tools require auxiliary services to gather performance data before it can be examined and queried. It then collects performance data using existing database services running on your system. It’s all monitored remotely ! Nothing is installed on your IBM i systems.
They can be expensive to implement and maintain, rely on fragile data pipelines, and require highly skilled data analysts to ensure ongoing relevance. Most business processes are not monitored. First and foremost, it’s a data problem.
The urgency of monitoring these batch jobs can’t be overstated. Monitor batch jobs Monitoring is critical for batch jobs because it ensures that essential tasks, such as data processing and system maintenance, are completed on time and without errors. if (record["start_time"]) batch[runId].JobStarted
We organize all of the trending information in your field so you don't have to. Join 5,000+ users and stay up to date on the latest articles your peers are reading.
You know about us, now we want to get to know you!
Let's personalize your content
Let's get even more personalized
We recognize your account from another site in our network, please click 'Send Email' below to continue with verifying your account and setting a password.


Let's personalize your content