This site uses cookies to improve your experience. To help us insure we adhere to various privacy regulations, please select your country/region of residence. If you do not select a country, we will assume you are from the United States. Select your Cookie Settings or view our Privacy Policy and Terms of Use.
Cookie Settings
Cookies and similar technologies are used on this website for proper function of the website, for tracking performance analytics and for marketing purposes. We and some of our third-party providers may use cookie data for various purposes. Please review the cookie settings below and choose your preference.
Used for the proper function of the website
Used for monitoring website traffic and interactions
Cookie Settings
Cookies and similar technologies are used on this website for proper function of the website, for tracking performance analytics and for marketing purposes. We and some of our third-party providers may use cookie data for various purposes. Please review the cookie settings below and choose your preference.
Strictly Necessary: Used for the proper function of the website
Performance/Analytics: Used for monitoring website traffic and interactions
When we launched the new Dynatrace experience, we introduced major updates to the platform, including Grail ™, our innovative data lakehouse unifying observability, security, and business data, and Dynatrace Query Language ( DQL ) for accessing and exploring unified data.
There’s a goldmine of business data traversing your IT systems, yet most of it remains untapped. To unlock business value, the data must be: Accessible from anywhere. Data has value only when you can access it, no matter where it lies. Agile business decisions rely on fresh data. Easy to access. Contextualized.
To provide maximum freedom in selecting the service-level indicators that matter most to your business, Dynatrace combines SLOs with the power of Dynatrace Grail™ data lakehouse, the central data platform with heterogeneous and contextually linked data. This is where Grail, the Dynatrace central data platform, excels.
One of the things I love most about OpenTelemetry (OTel) is that its vendor-neutral, which means you can send the same OpenTelemetry data to different vendors. In fact, most of the major Observability vendors out there not only support ingesting OpenTelemetry data but also actively contribute to the project, including Dynatrace.
Take your monitoring, data exploration, and storytelling to the next level with outstanding data visualization All your applications and underlying infrastructure produce vast volumes of data that you need to monitor or analyze for insights. Use color coding to tell a story. Min and max limits.
In this blog post, we’ll walk you through a hands-on demo that showcases how the Distributed Tracing app transforms raw OpenTelemetry data into actionable insights Set up the Demo To run this demo yourself, you’ll need the following: A Dynatrace tenant. If you don’t have one, you can use a trial account.
Microsoft Azure SQL is a robust, fully managed database platform designed for high-performance querying, relational data storage, and analytics. An application software generates user metrics on a daily basis, which can be used for reports or analytics.
Imagine you’re using a lot of OpenTelemetry and Prometheus metrics on a crucial platform. You’re gathering a lot of data, but you can’t make sense of it. A histogram is a specific type of metric that allows users to understand the distribution of data points over a period of time.
In IT and cloud computing, observability is the ability to measure a system’s current state based on the data it generates, such as logs, metrics, and traces. As teams begin collecting and working with observability data, they are also realizing its benefits to the business, not just IT. What is observability?
The release candidate of OpenTelemetry metrics was announced earlier this year at Kubecon in Valencia, Spain. Since then, organizations have embraced OTLP as an all-in-one protocol for observability signals, including metrics, traces, and logs, which will also gain Dynatrace support in early 2023.
Welcome, data enthusiasts! Whether you’re a seasoned IT expert or a marketing professional looking to improve business performance, understanding the data available to you is essential. In this blog series, we’ll guide you through creating powerful dashboards that transform complex data into actionable insights.
Recently, I encountered a task where a business was using AWS Elastic Beanstalk but was struggling to understand the system state due to the lack of comprehensive metrics in CloudWatch. By default, CloudWatch only provides a few basic metrics such as CPU and Networks.
Exploratory analytics now cover more bespoke scenarios, allowing you to access any element of test results stored in the Dynatrace Grail data lakehouse. Select any execution you’re interested in to display its details, for example, the content response body, its headers, and related metrics.
My goal was to provide IT teams with insights to optimize customer experience by collaborating with business teams, using both business KPIs and IT metrics. Key insights for executives: Optimize customer experiences through end-to-end contextual analytics from observability, user behavior, and business data.
To understand whats happening in todays complex software ecosystems, you need comprehensive telemetry data to make it all observable. With so many types of technologies in software stacks around the globe, OpenTelemetry has emerged as the de facto standard for gathering telemetry data. But, generating telemetry data is the easy part.
Through this integration, Dynatrace enriches data collected by Microsoft Sentinel to provide organizations with enhanced data insights in context of their full technology stack. In Microsoft Sentinel, security teams benefit from all the signals Dynatrace Davis® AI automatically generates without unsustainable, manual effort.
Chances are, youre a seasoned expert who visualizes meticulously identified key metrics across several sophisticated charts. However, your responsibilities might change or expand, and you need to work with unfamiliar data sets. Your trained eye can interpret them at a glance, a skill that sets you apart.
This challenge has given rise to the discipline of observability engineering, which concentrates on the details of telemetry data to fine-tune observability use cases. To get a more granular look into telemetry data, many analysts rely on custom metrics using Prometheus.
Improving collaboration across teams By surfacing actionable insights and centralized monitoring data, Dynatrace fosters collaboration between development, operations, security, and business teams. This data covers all aspects of CI/CD activity, from workflow executions to runner performance and cost metrics.
Cloud service providers (CSPs) share carbon footprint data with their customers, but the focus of these tools is on reporting and trending, effectively targeting sustainability officers and business leaders. We implemented a wasted energy metric in the app to enhance practitioner actionability.
ABAC has several advantages: Enhanced security , providing granular control over access permissions, significantly reducing the risk of data breaches and unauthorized activities. High granularity by segmenting resource and record-level data, ensuring that access decisions are precise and context-aware.
In today’s data-driven world, businesses across various industry verticals increasingly leverage the Internet of Things (IoT) to drive efficiency and innovation. Both methods allow you to ingest and process raw data and metrics. The ADS-B protocol differs significantly from web technologies.
The addition of more and more metrics over time has only made this increasingly complex. As a result, it’s challenging to get business and resources focused on performance and error optimization without supporting data that shows how those optimizations will impact your organization’s financial outcomes.
AI transformation, modernization, managing intelligent apps, safeguarding data, and accelerating productivity are all key themes at Microsoft Ignite 2024. Adopting AI to enhance efficiency and boost productivity is critical in a time of exploding data, cloud complexities, and disparate technologies.
As a result, organizations need to monitor mobile app performance metrics that are meaningful and actionable by gaining adequate observability of mobile app performance. There are many common mobile app performance metrics that are used to measure key performance indicators (KPIs) related to user experience and satisfaction.
The data community is striving to incorporate the core concepts of engineering rigor found in software communities but still has further to go. This talk covers ways to leverage software engineering practices for data engineering and demonstrates how measuring key performance metrics could help build more robust and reliable data pipelines.
We are in the era of data explosion, hybrid and multicloud complexities, and AI growth. Dynatrace analyzes billions of interconnected data points to deliver answers, not just data and dashboards sending signals without a path to resolution. Picture gaining insights into your business from the perspective of your users.
Organizations choose data-driven approaches to maximize the value of their data, achieve better business outcomes, and realize cost savings by improving their products, services, and processes. However, there are many obstacles and limitations along the way to becoming a data-driven organization. Understanding the context.
In a digital-first world, site reliability engineers and IT data analysts face numerous challenges with data quality and reliability in their quest for cloud control. Increasingly, organizations seek to address these problems using AI techniques as part of their exploratory data analytics practices.
Some time ago, at a restaurant near Boston, three Dynatrace colleagues dined and discussed the growing data challenge for enterprises. At its core, this challenge involves a rapid increase in the amount—and complexity—of data collected within a company. Work with different and independent data types. Thus, Grail was born.
I have ingested important custom data into Dynatrace, critical to running my applications and making accurate business decisions… but can I trust the accuracy and reliability?” ” Welcome to the world of data observability. At its core, data observability is about ensuring the availability, reliability, and quality of data.
In today's cloud computing world, all types of logging data are extremely valuable. Logs can include a wide variety of data, including system events, transaction data, user activities, web browser logs, errors, and performance metrics. This innovative service is transforming the way organizations handle their log data.
ln a world driven by macroeconomic uncertainty, businesses increasingly turn to data-driven decision-making to stay agile. They’re unleashing the power of cloud-based analytics on large data sets to unlock the insights they and the business need to make smarter decisions. All of these factors challenge DevOps maturity.
That is, relying on metrics, logs, and traces to understand what software is doing and where it’s running into snags. OpenTelemetry, the open source observability tool, has emerged as an industry-standard solution for instrumenting application telemetry data to make it observable.
DevOps and security teams managing today’s multicloud architectures and cloud-native applications are facing an avalanche of data. This has resulted in visibility gaps, siloed data, and negative effects on cross-team collaboration. At the same time, the number of individual observability and security tools has grown.
Grail: Enterprise-ready data lakehouse Grail, the Dynatrace causational data lakehouse, was explicitly designed for observability and security data, with artificial intelligence integrated into its foundation. Tables are a physical data model, essentially the type of observability data that you can store.
While this approach can be effective if the model is trained with a large amount of data, even in the best-case scenarios, it amounts to an informed guess, rather than a certainty. But to be successful, data quality is critical. Teams need to ensure the data is accurate and correctly represents real-world scenarios. Consistency.
It also requires agencies to develop digital experiences that are user-centric and data-driven. When combined, key metrics will generate an accurate CX index score. But which metrics should your agency include? But which metrics should your agency include? Abandonment rate and data.
Log data—the most verbose form of observability data, complementing other standardized signals like metrics and traces—is especially critical. As cloud complexity grows, it brings more volume, velocity, and variety of log data. They also need a high-performance, real-time analytics platform to make that data actionable.
Amazon Bedrock , equipped with Dynatrace Davis AI and LLM observability , gives you end-to-end insight into the Generative AI stack, from code-level visibility and performance metrics to GenAI-specific guardrails. Send unified data to Dynatrace for analysis alongside your logs, metrics, and traces.
The jobs executing such workloads are usually required to operate indefinitely on unbounded streams of continuous data and exhibit heterogeneous modes of failure as they run over long periods. Recovery time of the throughput metric. Performance is usually a primary concern when using stream processing frameworks.
In this example, well deploy the OpenTelemetry demo application to send telemetry directly to Dynatrace using OTLP so you can see how Dynatrace presents the OTel data without the additional context OneAgent provides. The configuration also includes an optional span metrics connector, which generates Request, Error, and Duration (R.E.D.)
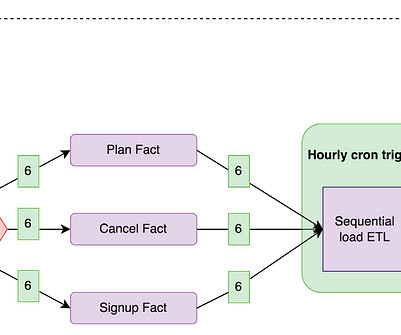
By Abhinaya Shetty , Bharath Mummadisetty At Netflix, our Membership and Finance Data Engineering team harnesses diverse data related to plans, pricing, membership life cycle, and revenue to fuel analytics, power various dashboards, and make data-informed decisions. We expect complete and accurate data at the end of each run.
We organize all of the trending information in your field so you don't have to. Join 5,000+ users and stay up to date on the latest articles your peers are reading.
You know about us, now we want to get to know you!
Let's personalize your content
Let's get even more personalized
We recognize your account from another site in our network, please click 'Send Email' below to continue with verifying your account and setting a password.


Let's personalize your content