This site uses cookies to improve your experience. To help us insure we adhere to various privacy regulations, please select your country/region of residence. If you do not select a country, we will assume you are from the United States. Select your Cookie Settings or view our Privacy Policy and Terms of Use.
Cookie Settings
Cookies and similar technologies are used on this website for proper function of the website, for tracking performance analytics and for marketing purposes. We and some of our third-party providers may use cookie data for various purposes. Please review the cookie settings below and choose your preference.
Used for the proper function of the website
Used for monitoring website traffic and interactions
Cookie Settings
Cookies and similar technologies are used on this website for proper function of the website, for tracking performance analytics and for marketing purposes. We and some of our third-party providers may use cookie data for various purposes. Please review the cookie settings below and choose your preference.
Strictly Necessary: Used for the proper function of the website
Performance/Analytics: Used for monitoring website traffic and interactions
In today’s data-driven world, businesses across various industry verticals increasingly leverage the Internet of Things (IoT) to drive efficiency and innovation. IoT is transforming how industries operate and make decisions, from agriculture to mining, energy utilities, and traffic management.
Monitoring Time-Series IoT Device Data Time-series data is crucial for IoT device monitoring and data visualization in industries such as agriculture, renewable energy, and meteorology. In this tutorial, we will guide you through the process of setting up a monitoring system for IoT device data.
In the era of the Internet of Things ( IoT) , the continuous influx of spatial and temporal data from interconnected devices has given rise to a vast and intricate landscape, demanding a sophisticated approach to database management.
According to Forbes , " the global IoT market can grow from $157B in 2016 to $457B by 2020, attaining a Compound Annual Growth Rate (CAGR) of 28.5 Adoption of IoT (Internet of Things) is increasing across various industries, in government sectors, and in consumers’ day-to-day life.
Key insights for executives: Optimize customer experiences through end-to-end contextual analytics from observability, user behavior, and business data. Dynatrace connects service-side observability data to customers’ experiences and business outcomes. Avoid the cost of customer churn by optimizing customer experience.
In the rapidly evolving landscape of the Internet of Things (IoT), edge computing has emerged as a critical paradigm to process data closer to the source—IoT devices. This proximity to data generation reduces latency, conserves bandwidth and enables real-time decision-making.
IoT has ushered in an era of unprecedented connectivity and data collection. IoT edge devices, ranging from sensors to industrial machines, have become integral to various industries, offering insights, automation, and efficiency. However, managing a large number of these edge devices efficiently poses a significant challenge.
It can scale towards a multi-petabyte level data workload without a single issue, and it allows access to a cluster of powerful servers that will work together within a single SQL interface where you can view all of the data. This feature-packed database provides powerful and rapid analytics on data that scales up to petabyte volumes.
When building an IoT-based service, we need to implement a messaging mechanism that transmits data collected by the IoT devices to a hub or a server. When dealing with IoT, one of the first things that come to mind is the limited processing, networking, and storage capabilities these devices operate with.
The newly introduced step-by-step guidance streamlines the process, while quick data flow validation accelerates the onboarding experience even for power users. After successfully installing OneAgent, the log ingestion wizard provides a host selector drop-down to validate the data flow.
Advances in the Industrial Internet of Things (IIoT) and edge computing have rapidly reshaped the manufacturing landscape, creating more efficient, data-driven, and interconnected factories. This convergence promises not only to streamline operations but also to unlock new levels of automation, data insight, and responsiveness.
In this tutorial, you are going to learn about QuestDB SQL extensions which prove to be very useful with time-series data. Using some sample data sets, you will learn how designated timestamps work and how to use extended SQL syntax to write queries on time-series data.
Edge computing has transformed how businesses and industries process and manage data. By bringing computation closer to the data source, edge-based deployments reduce latency, enhance real-time capabilities, and optimize network bandwidth. Data interception during transit. Redundancy and inefficiency in data aggregation.
These places might have important data that could help us better understand earth and its history, as well as life on other planets. The answer to this question is actually on your phone, your smartwatch, and billions of other places on earth—it's the Internet of Things (IoT).
If you're involved in the IoT (Internet of Things) space or have embarked on any journey involving real-time data transfer, you've probably come across MQTT (Message Queuing Telemetry Transport). MQTT is a lightweight, publish-subscribe network protocol that transports messages between devices, often known as the backbone for IoT.
In short, it is the ability to handle more data, more users, and more demand without sacrificing performance, reliability, or security. The reason is straightforward, today, applications generate enormous amounts of data. It is not uncommon to question why scalability has grabbed the attention of the masses these days.
RabbitMQ is designed for flexible routing and message reliability, while Kafka handles high-throughput event streaming and real-time data processing. Both serve distinct purposes, from managing message queues to ingesting large data volumes.
Coaching staffs, decision makers, and even the announcers are using data to make real-time decisions, each team constantly working to gain even a fraction of an advantage over its opponent. One of the things that I find most interesting about football is how the evolution of technology is having an impact on its progression.
We all know that data is being generated at an unprecedented rate. You may also know that this has led to an increase in the demand for efficient and secure data storage solutions that won’t break the bank. This article will explore what edge data platforms and real-time services are, why they are important, and how they can be used.
Each service comes with zero-configuration, automatic instance detection, continuous data capture in context, and what’s most important – thanks to our AI engine Davis – is each service provides answers, not just data. AWS IoT Analytics. AWS IoT Things Graph. AWS Elastic Beanstalk. AWS Elemental MediaPackage. Amazon Lex.
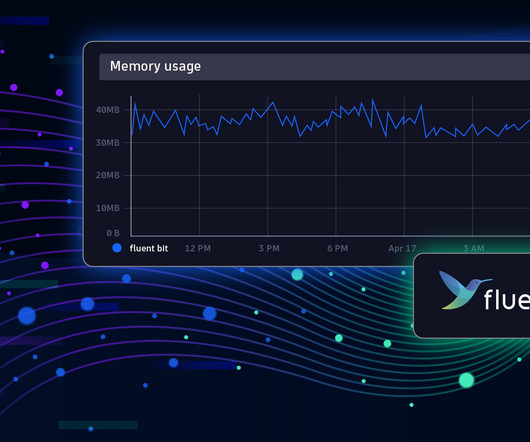
Fluent Bit is a telemetry agent designed to receive data (logs, traces, and metrics), process or modify it, and export it to a destination. Fluent Bit can serve as a proxy before you send data to Dynatrace or similar. However, you can also use Fluent Bit as a processor because you can perform various actions on the data.
Data analysis within large and highly dynamic microservices environments is the biggest challenge that Application Performance Monitoring (APM) vendors face today. While data collection itself is an integral part of APM, it’s ultimately only a means to an end. The real challenge is robust and effective analysis of such data.
Similar to AWS Lambda , Azure Functions is a serverless compute service by Microsoft that can run code in response to predetermined events or conditions (triggers), such as an order arriving on an IoT system, or a specific queue receiving a new message. Azure IoT Functions, for instance, processes requests for Azure IoT Edge.
A robust application security strategy is vital to ensuring the safety of your organization’s data and applications. Finally, a strong exposure management posture can help increase organizations’ confidence in their overall application security approach, keeping their data and systems safeguarded from potential attacks.
Digital experience monitoring enables companies to respond to issues more efficiently in real time, and, through enrichment with the right business data, understand how end-user experience of their digital products significantly affects business key performance indicators (KPIs).
Monitor batch jobs Monitoring is critical for batch jobs because it ensures that essential tasks, such as data processing and system maintenance, are completed on time and without errors. Parsing the log lines that have critical data related to batch job status Now that we can parse critical information, we can make informed decisions.
Connecting IoT devices (for example, AWS IoT Device Management ). Data usage, request handling, and processing time accumulate. You can build your own data warehouse-driven dashboards in AWS Quicksight or tools such as Tableau, but creating, maintaining, and modifying these assets can be challenging and time-consuming.
As distributed systems play a critical role in various domains such as cloud computing , Internet of Things ( IoT ), and data centers, optimizing energy consumption has significant implications for reducing operational costs and mitigating the environmental impact.
As the world becomes increasingly interconnected with the proliferation of IoT devices and a surge in applications, digital transactions, and data creation, mobile monitoring — monitoring mobile applications — grows ever more critical.
AWS offers a broad set of global, cloud-based services including computing, storage, networking, Internet of Things (IoT), and many others. Amazon Kinesis Data Analytics. Amazon Kinesis Data Firehose. Amazon Kinesis Data Streams (KDS). Dynatrace news. Amazon Elastic File System (EFS). Amazon EMR. Amazon Redshift.
In IT and cloud computing, observability is the ability to measure a system’s current state based on the data it generates, such as logs, metrics, and traces. As teams begin collecting and working with observability data, they are also realizing its benefits to the business, not just IT. What is observability?
The telecommunications industry has become an indispensable part of our interconnected society, fueling various functions ranging from traditional calls to lightning-fast Internet and the ever-expanding Internet of Things ( IoT ).
AWS offers a broad set of global, cloud-based services including computing, storage, networking, Internet of Things (IoT), and many others. Amazon Kinesis Data Analytics. Amazon Kinesis Data Firehose. Amazon Kinesis Data Streams (KDS). Dynatrace news. Amazon Elastic File System (EFS). Amazon EMR. Amazon Redshift.
They provide a centralized platform that promotes seamless communication and data exchange between software applications, reducing data silos. ERP systems enhance collaboration, streamline workflows, automate tasks, and provide robust data management and analysis capabilities.
This article expands on the most commonly used RabbitMQ use cases, from microservices to real-time notifications and IoT. Key Takeaways RabbitMQ is a versatile message broker that improves communication across various applications, including microservices, background jobs, and IoT devices.
Without any configuration or the need for a data scientist, Davis provides instant and automatic answers to degradations in service, anomalies in behavior, and impact on user experience so that I&O teams can chart a clear course of action to resolve issues. This ensures greater agility and reduces the time to resolution. New to Dynatrace?
Trying to manually keep up, configure, script and source data is beyond human capabilities and today everything must be automated and continuous. Experience and outcomes matter, whether it’s mobile app-to-user, IoT device-to-customers, or an application behind the scenes. Continuous Automation.
Since we’re familiar with what data Support would need, it helps with faster resolution of the ticket, and means you don’t have to repeat yourself. We realize that with this pace of innovation and product enhancements, you’ll probably have a range of questions from infrastructure, IoT monitoring, to “What does this new icon mean?”.
In doing so, organizations are maximizing the strategic value of their customer data and gaining a competitive advantage. How behavior analytics works User behavior analytics works by first collecting, then analyzing user behavior data. An organization may collect this data the following ways.
These include website hosting, database management, backup and restore, IoT capabilities, e-commerce solutions, app development tools and more, with new services released regularly. Real-time stream processing to perform live activity tracking, data cleansing, metrics generation, and more. Data entering a stream.
Companies now leverage AI algorithms to analyze large data sets from connected machinery, detecting patterns that signal wear or impending failures. As industries adopt these technologies, preventive maintenance is evolving to support smarter, data-driven decision-making, ultimately boosting efficiency, safety, and cost savings.
Extending the three pillars approach, IT teams must augment telemetry collection with user experience data to eliminate blind spots: Metrics – Values represented as counts or measures that are often calculated or aggregates over a time period. Obviously, data collection is only the start.
Functions integrate with APIs (such as the Video Intelligence API ) to make this possible, forming a processing chain that eventually commits data to cloud storage. GCF also has relevance in IoT and file processing tasks. Overall, these functions excel in scenarios where data enrichment and logic application are paramount.
Our customers have frequently requested support for this first new batch of services, which cover databases, big data, networks, and computing. See the health of your big data resources at a glance. Azure HDInsight supports a broad range of use cases including data warehousing, machine learning, and IoT analytics.
We organize all of the trending information in your field so you don't have to. Join 5,000+ users and stay up to date on the latest articles your peers are reading.
You know about us, now we want to get to know you!
Let's personalize your content
Let's get even more personalized
We recognize your account from another site in our network, please click 'Send Email' below to continue with verifying your account and setting a password.


Let's personalize your content