This site uses cookies to improve your experience. To help us insure we adhere to various privacy regulations, please select your country/region of residence. If you do not select a country, we will assume you are from the United States. Select your Cookie Settings or view our Privacy Policy and Terms of Use.
Cookie Settings
Cookies and similar technologies are used on this website for proper function of the website, for tracking performance analytics and for marketing purposes. We and some of our third-party providers may use cookie data for various purposes. Please review the cookie settings below and choose your preference.
Used for the proper function of the website
Used for monitoring website traffic and interactions
Cookie Settings
Cookies and similar technologies are used on this website for proper function of the website, for tracking performance analytics and for marketing purposes. We and some of our third-party providers may use cookie data for various purposes. Please review the cookie settings below and choose your preference.
Strictly Necessary: Used for the proper function of the website
Performance/Analytics: Used for monitoring website traffic and interactions
Migrating Critical Traffic At Scale with No Downtime — Part 1 Shyam Gala , Javier Fernandez-Ivern , Anup Rokkam Pratap , Devang Shah Hundreds of millions of customers tune into Netflix every day, expecting an uninterrupted and immersive streaming experience. This approach has a handful of benefits.
Migrating Critical Traffic At Scale with No Downtime — Part 2 Shyam Gala , Javier Fernandez-Ivern , Anup Rokkam Pratap , Devang Shah Picture yourself enthralled by the latest episode of your beloved Netflix series, delighting in an uninterrupted, high-definition streaming experience. This is where large-scale system migrations come into play.
With the advent of cloud computing, managing network traffic and ensuring optimal performance have become critical aspects of system architecture. Amazon Web Services (AWS), a leading cloud service provider, offers a suite of load balancers to manage network traffic effectively for applications running on its platform.
Even when the staging environment closely mirrors the production environment, achieving a complete replication of all potential scenarios, such as simulating extremely high traffic volumes to assess software performance, remains challenging. This can lead to a lack of insight into how the code will behave when exposed to heavy traffic.
What was once an onslaught of consumer traffic between Black Friday and Cyber Monday has turned into a weeklong event, with most retailers offering deals well ahead of Black Friday. For example, this year I was doing comparisons of headphones to purchase. This year we saw few, if any, major issues with online retailers.
In this case, we have a quite well-defined scenario that can resemble the image below: In this scenario, the proxies must sit inside Pods, balancing the incoming traffic from the Service LoadBalancer connecting with the active data nodes.
A handy list of RSS readers with feature comparisons ( Hacker News). Improving testing by using real traffic from production ( Hacker News). A Study on Solving Callbacks with JavaScript Generators ( Hacker News). History of Lisp ( Hacker News).
Architecture Comparison RabbitMQ and Kafka have distinct architectural designs that influence their performance and suitability for different use cases. However, performance can decline under high traffic conditions. RabbitMQ is based on message queues and exchanges, enabling flexible routing and message acknowledgment.
First, it helps to understand that applications and all the services and infrastructure that support them generate telemetry data based on traffic from real users. So how can teams start implementing SLOs? This telemetry data serves as the basis for establishing meaningful SLOs.
It detects regressions and deviations from previously observed behavior, including latency, traffic, error rates, saturation, security coverage, vulnerability risk levels, and memory consumption. Davis will also assist Site Reliability Guardian in recommending relevant objectives and baselines for comparison.
The built-in unified analysis pages offer real-time comparison of key performance indicators while applying a topology-first approach to the data. The F5 BIG-IP LTM extension offers a complete view, beyond simple metrics, into your Local Traffic Manager (LTM) platform. Interfaces. HTTP, ServerSSL, and ClientSSL profiles.
Automated release inventory and version comparison , which allows teams to easily evaluate the performance of individual release versions, and as needed, roll back to a previous version. Automated release inventory and version comparison. ” – Wim Verhaeghe, KBI-Connect DevOps team lead at Inetum-Realdolmen.
All-traffic monitoring, analysis on demand—network performance management started to grow as an independent engineering discipline. Real-time network performance analysis capabilities, including SSL decryption, enabled precise reconstruction of end user application states through the analysis of network traffic.
I selfishly look at my blog posts (like this one) and see whether LinkedIn, or Twitter, drove more traffic! Lastly, I often do a week on week or quarterly comparisons with simple date toggles so I can compare time periods. Which channels has my users (or robots and spam for that matter) come in from (direct, search, social, email)?
1) depicts the migration of traffic from fixed bitrates to DO encodes. 1: Migration of traffic from fixed-ladder encodes to DO encodes. By June 2023 the entire HDR catalog was optimized. The graphic below (Fig.
How is the new version behaving in comparison to previous versions? The release inventory highlights releases that include detected problems and shows the throughput of those versions so that you see how much traffic is routed to each release.
Once Dynatrace sees the incoming traffic it will also show up in Dynatrace, under Transaction & Services. Step 7 accomplished : While there are several options to compare test runs, the multi dimensional analysis view gives us a great starting point into the comparison views of Dynatrace. SimpleNodeJsService.
Frequencies of 100 most frequent elements can be estimated with 4% precision using Count-Min Sketch structure that uses about 48KB (12k integer counters, based on the experimental result), assuming that data is skewed in accordance with Zipfian distribution that models well natural texts, many types of web events and network traffic.
And it added to the network traffic in terms of new version distribution. A comparison of the previous and new steps to accomplish the same goals is shown in the table below. This storage space was consumed not only on our own infrastructure but also on each of the Dynatrace cluster nodes in the case of Managed deployments.
Benchmark results for DLV-enabled instance vs. standard instance Write-only traffic Read-write traffic Read-only traffic Benchmarking analysis For both read-only and read-write traffic, there is a constant improvement in the QPS counters as the number of threads increases.
An apples to apples comparison of the costs associated with running various usage patterns on-premises and with AWS requires more than a simple comparison of hardware expense versus always-on utility pricing for compute and storage. Making predictions about web traffic is a very difficult endeavor. Total Cost of Ownership.
WebP means faster loading times and less traffic. WebP size comparison In previous case studies, we've analyzed the different image sizes against WebP. Check out our reports: JPG to WebP - Size Comparison WebP results in a 85.87% decrease in image size on average. PNG to WebP - Size Comparison WebP results in a 42.8%
In this comparison of Redis vs Memcached, we strip away the complexity, focusing on each in-memory data store’s performance, scalability, and unique features. Performance Comparison: Redis vs Memcached Although Redis and Memcached are high-performance in-memory data stores, their performance characteristics are distinct.
A quick way to fix this is simply by temporarily changing the TTL (time to live) setting for the DNS record, and route your traffic to the second DNS server until the outage is fixed. Visit website DNS hosting providers comparison How do the free DNS providers stack up against the premium DNS services? They do quite well actually.
Angular is still one of the most used Javascript-based frameworks for high traffic websites. Here, we put the comparisons down as a summary for you: Features Testsigma Cypress Playwright Puppeteer TestCafe Webdriver IO Who can use it? The post Comparison between Testsigma and Protractor alternatives appeared first on Testsigma Blog.
These days, with mobile traffic accounting for over 50% of web traffic , it’s fair to assume that the very first encounter of your prospect customers with your brand will happen on a mobile device. You can check the mobile view of your website in a side by side comparison view with mirrored interactions and touch support.
The origin value is an aggregate of the values of all the pages for that origin, computed as a weighted average based on page traffic. This means that an origin that has relatively little traffic, but sufficient to be included in the dataset, is counted equally to a very popular, high-traffic origin. Large preview ).
This guarantees a rapid experience that can efficiently handle the pressures of intense data traffic and intricate queries. Version Support Comparison MongoDB Atlas vs ScaleGrid The comparison highlights the distinct differences in version support.
Perceptual quality measurements are used to drive video encoding optimizations , perform video codec comparisons , carry out A/B testing and optimize streaming QoE decisions to mention a few. Moorthy and Zhi Li Introduction Measuring video quality at scale is an essential component of the Netflix streaming pipeline.
s Time taken to import 120000000 document: 7412 seconds We can see from the above comparison that we can save almost 3GB of disk space without impacting the CPU or memory. Network compression MongoDB also offers network compression.
When used in prevention mode (IPS), this all has to happen inline over incoming traffic to block any traffic with suspicious signatures. The baseline for comparison is Snort 3.0 , “the most powerful IPS in the world” according to the Snort website. This makes the whole system latency sensitive.
I broke the percentages down by page rank (based on traffic to the site). In sticking with the original analysis, I’m comparing Time to First Byte (how long it takes for the first bytes of the first request to start arriving from the server) compared to the total load time (when onLoad fires). First up, the mobile results. 1,001 - 10,000 12.5%
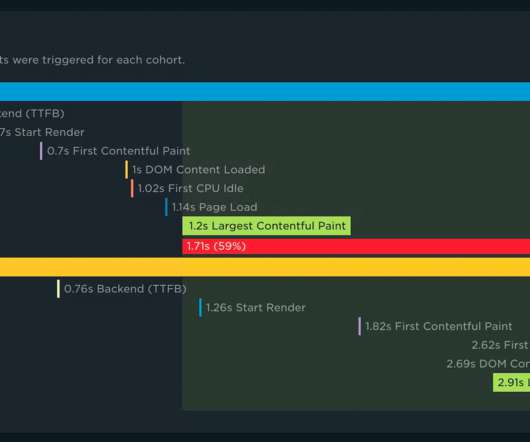
With your RUM Compare dashboard, you can easily generate side-by-side comparisons for any two cohorts of data. Triage a performance regression related to the latest change or deployment to your site by looking at a before/after comparison. Evaluate CDN performance by exploring the impact of time-of-day traffic patterns.
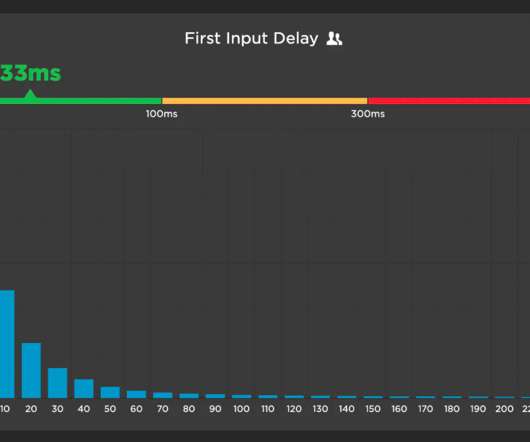
When looking at the load event for comparison, we can see that the first input occurs very late. Traffic for these sites has been extremely high, given increased online activity due to COVID, not to mention the huge volume of cyber shopping happening as we speak. Page experience timeline illustrating typical sequence of metrics.
According to StatCounter , as of December 2020, mobile traffic has surpassed desktop traffic with 55.73% of traffic coming from mobile devices. For a comparison between Foundation and Bootstrap, read our complete article, Bootstrap vs Foundation. Pros: No style lock-in, so you have greater flexibility.
Intuitively, modifying a DOM subtree should generate less CPU load and need less network traffic than tearing down the entire contents of a document, asking the server to compose a new one, and then parsing/rendering it along with all of its subresources. Objections to the comparison are legion.
It’s “single-threaded,” which is how we get the one-way street comparison. We can expand the metric to glean insights into what exactly is causing traffic on the main thread. We want fewer cars on the road to alleviate traffic on the main thread. Credit: Brandon Nelson on Unsplash. JavaScript operates in much the same way.
HTTP/2 versus HTTP/3 protocol stack comparison ( Large preview ). For example, if the device is a firewall, it might be configured to block all traffic containing (unknown) extensions. In the early days of the Internet, encrypting traffic was quite costly in terms of processing.
Traffic size. We see a large variety of sites at SpeedCurve, representing an assortment of countries, industry segments, traffic levels and more. Traffic fluctuates based on the hour of the day, day of the week, and due to seasonality. Note the consistency in the 95th percentile illustrated in these comparison charts.
With your RUM Compare dashboard , you can easily generate side-by-side comparisons for any two cohorts of real user data. Triage a performance regression related to the latest change or deployment to your site by looking at a before/after comparison. Evaluate CDN performance by exploring the impact of time-of-day traffic patterns.
If there is a sudden increase in traffic for an application that fails on the public cloud, it becomes impractical to use cloud bursting as a solution which leads to inevitable periods without service. What is the primary benefit of multi-cloud solutions in comparison to hybrid cloud solutions? </p>
You can prioritize them by how many URLs they affect or how much of your real user traffic they affect. Not only does the Improve dashboard round up all your recommendations in one place, it shows you which optimizations you should tackle first. ––––– 7.
Meanwhile, on Android, the #2 and #3 sources of web traffic do not respect browser choice. On Android today and early iOS versions, WebViews allow embedders to observe and modify all network traffic (regardless of encryption). Users can have any browser with any engine they like, but it's unlikely to be used. How can that be?
Since then, it’s been beaten by Facebook’s Threads, though that’s not really a fair comparison.) None of these alternatives generate significant search traffic at O’Reilly, but that doesn’t mean that they won’t in the future, or that they aren’t an important part of the ecosystem. There are plenty of reasons for this surge.
We organize all of the trending information in your field so you don't have to. Join 5,000+ users and stay up to date on the latest articles your peers are reading.
You know about us, now we want to get to know you!
Let's personalize your content
Let's get even more personalized
We recognize your account from another site in our network, please click 'Send Email' below to continue with verifying your account and setting a password.


Let's personalize your content