This site uses cookies to improve your experience. To help us insure we adhere to various privacy regulations, please select your country/region of residence. If you do not select a country, we will assume you are from the United States. Select your Cookie Settings or view our Privacy Policy and Terms of Use.
Cookie Settings
Cookies and similar technologies are used on this website for proper function of the website, for tracking performance analytics and for marketing purposes. We and some of our third-party providers may use cookie data for various purposes. Please review the cookie settings below and choose your preference.
Used for the proper function of the website
Used for monitoring website traffic and interactions
Cookie Settings
Cookies and similar technologies are used on this website for proper function of the website, for tracking performance analytics and for marketing purposes. We and some of our third-party providers may use cookie data for various purposes. Please review the cookie settings below and choose your preference.
Strictly Necessary: Used for the proper function of the website
Performance/Analytics: Used for monitoring website traffic and interactions
Having laid the foundation during the deployment stage, we’ll now explore the benefits of Dynatrace visibility and orchestration during the testing phase. T he testing stage plays a crucial role in ensuring the quality of newly built code through the execution of automated test cases.
Selenium Grid has been an integral part of automation testing, as it lets you performtest case execution on different combinations of browsers, operating systems (or platforms), and machines. It also enables you to perform parallel execution to expedite the cross-browser testing process.
In the process of testing a software application, test plans and test strategies are quite crucial. A strong test plan and strategy will always prevent errors in the application. As software testers, we should be aware of these 2 phrases, as they are critical in testing software applications.
PostgreSQL DigitalOcean PerformanceTest. In order to see which DBaaS provides the best PostgreSQL hosting performance on DigitalOcean, we are comparing equivalent plan sizes between ScaleGrid PostgreSQL on DigitalOcean and DigitalOcean Managed Databases: ScaleGrid PostgreSQL. Compare Pricing. Throughput. Benchmark Tool.
Here are the configurations for this comparison: Plan. Meltdown Performance Impact on MongoDB: AWS, Azure & DigitalOcean. See performancetests to determine the impact of the Meltdown CPU kernel patch on your MongoDB servers. Comparing MongoDB Performance on AWS, Azure & DigitalOcean. Dedicated Hosting.
On the left side of the loop, teams plan, develop, and test software in pre-production. Shift-left is the practice of moving testing, quality, and performance evaluation early in the software development process, thus the process of shifting to the “left” side of the DevOps lifecycle.
On the left side of the loop, teams plan, develop, and test software in pre-production. Shift-left is the practice of moving testing, quality, and performance evaluation early in the software development process, thus the process of shifting to the “left” side of the DevOps lifecycle.
After a new build gets deployed and automated tests executed, SLIs are evaluated against their SLOs and, depending on that result, a build is considered good (promoted) or bad (rolled back). “ Step-by-step guide: SRE-driven performance analysis with Dynatrace. This is what this blog is all about.
At Netflix the term “performance” usually encompasses both performance metrics (in the strict meaning) and memory metrics, and that’s how we’re using the term here. Why do we run PerformanceTests on commits? What are the PerformanceTests? Ideally we catch regressions before they even reach the main branch.
You’ll learn more about the best instance types and disks to use below, and you can check out this MySQL Provider Comparison to see the advantages and limitations of the top four managed MySQL solutions, ScaleGrid, Compose, Azure Database, and Amazon RDS. MySQL Dev/Test Environments: Standard Disks. High Availability Deployment.
As performance testers, we are often asked to compare the difference in the performance between two versions of an application. Introduction. Whatever the changes made in the second version (i.e., usage of new libraries, change of technological stack, etc.),
We are going to use a common, popular plan size using the below configurations for this performance benchmark: Comparison Overview. In this benchmark, we compare equivalent plan sizes between ScaleGrid MySQL on DigitalOcean and DigitalOcean Managed Databases for MySQL. DigitalOcean. Instance Type. Medium: 4 vCPUs. Medium: 4 vCPUs.
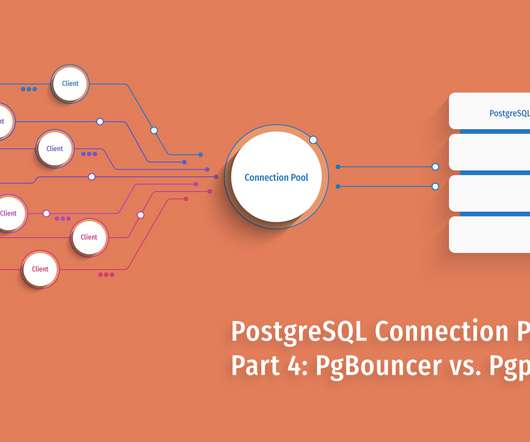
Our tests show that even a small number of clients can significantly benefit from using a connection pooler. Should You Use a PostgreSQL Connection Pooler? However, all of these problems are well-discussed in the PostgreSQL community, and mitigation strategies ensure the pros of a connection pooler far exceed their cons.
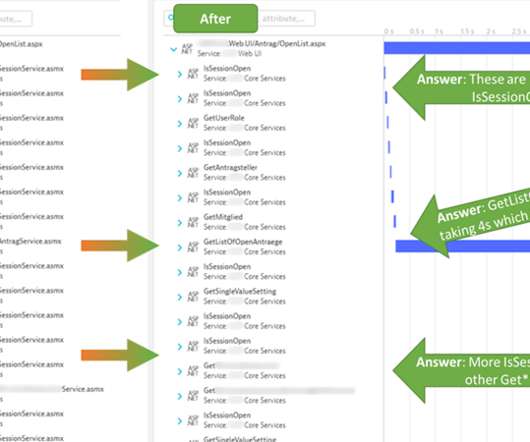
The screenshot below shows a PurePath that was shared with me by our partner triscon from Vienna, which specializes in Load and Performancetesting for large enterprise applications. Once installed, every single web service request processed by ASP.NET will be traced across all tiers and captured as a PurePath (Distributed Trace).
Gone are the days for Christian manually looking at dashboards and metrics after a new build got deployed into a testing or acceptance environment: Integrating Keptn into your existing DevOps tools such as GitLab is just a matter of an API call. Comparison across builds. Powerful configuration as code approach with SLIs & SLOs.
For a more detailed comparison of performance features between different versions, refer to: [link] Benchmarking Methodology Sysbench Overview Sysbench is a versatile, open-source benchmarking tool ideal for testing OLTP (Online Transaction Processing) database workloads. You can access the benchmark here: [link].
With the rise in the development requirement for Android apps, the need for testing Android applications has also increased to sustain in a competitive market. An ideal strategy for testing Android applications includes. Unit Tests – For verifying a minimal unit of source code. Manual Testing. Manual Testing.
In today’s world where ‘data is the new oil’ ( as said by Clive Humby), not giving proper attention to data-driven testing is not justified. If you have an application that needs data input in some form then it will require data-driven testing. The steps will be: Create and store the test data in a data repository.
However, it was interesting to evaluate performance of alternative approaches. In this article I describe several useful techniques that are based on SSE instructions and provide results of performancetesting for Lucene, Java, and C implementations. return count; }.
To test the performance of your solution, you’ll need to populate the table with larger volumes of sample data. numgroups AS INT = 1000 , @rowspergroup AS INT = 10000 , -- test with 1000 to 10000 here. My test machine has four logical CPUs, running SQL Server ® 2019 Enterprise. uniquevalues AS INT = 5 ; ALTER TABLE dbo.
Software testing is a huge domain, but it can be broadly categorized into two areas: manual testing and automated testing. Both manual and automated testing offer benefits and disadvantages. But with automated testing, test cases are executed with the assistance of tools, scripts, and software.
Load Testing: HTTP vs Headless vs Real Browser. Therefore, performancetesting has become a fundamental part of the development chain and the demand is still growing. Performancetesting platforms provide a broad range of load simulation methods such as HTTP, headless, and real browser-based. Comparison.
With the increased usage of smartphones in recent years, enterprises and the software industry now have to cater their applications to mobile devices for web testing in addition to desktops. Predominantly, there are two sets of tools that can cater to all your testing requirements when it comes to mobile web testing.
In a comment to my article, Marcos Kirchner mentioned that he tested my solution with varying table value constructor cardinalities, and got different execution times for the different cardinalities. Testing different base table cardinalities is just one dimension to try. Let’s proceed to performancetesting.
About two decades ago, testing was only limited to the desktop. With the rapidly increasing use of smartphones and ease of access to the internet across the globe, testing has spread across vast platforms. The native and mobile web browser testing is being performed more and more compared to desktop testing.
If we talk about testing itself — automation has taken us several leaps ahead; QA teams have solidified test efficiency and coverage even further. Gone are the days when automation testers had to learn coding to write test scripts. Enter codeless automation testing, which is one of the latest software trends to look out for.
Android developers and testers perform mobile tests to deliver apps that drive a high user retention rate through a great user interface. While mobile automation tests are performed for Android, iOS, and Windows devices, in this post, we’ll dive into the UI frameworks for Android automation testing.
In general, most websites or web apps run into errors because of a solitary reason: solid cross-browser testing isn’t performed. When you perform cross-browser testing, you validate visual elements and ensure all functional and non-functional aspects of the website are consistent across different browsers.
An outline of the main aspects of load simulation methods such as HTTP, headless, and real browser-based followed by a comparison matrix, to help you choose an appropriate simulation approach. The post Load Testing: HTTP vs Headless vs Real Browser appeared first on Dotcom-Monitor Web Performance Blog.
Bloom filter is liable to false positives, so it can not completely replace traditional checks using hash sets with attributes, but it can be used as a preliminary test to decrease a number of relatively expensive exact checks. Pattern: Probabilistic Test. Probabilistic testing is good to trade time to memory or IO to memory.
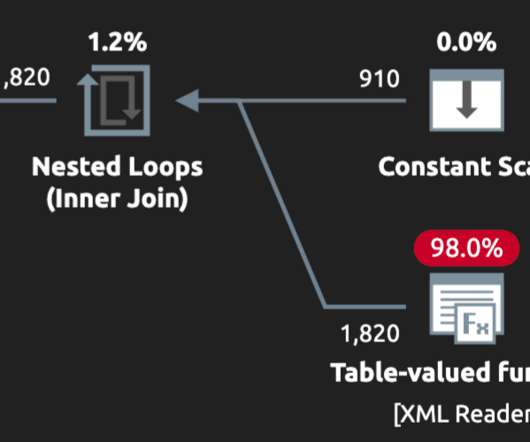
Meanwhile, in the GROUP BY query, the UDX only executes once for each unique UserID , the eager spool reads a much lower number of rows, there’s no distinct sort operator (it’s been replaced by a hash match), and the memory grant is tiny in comparison: Figure 5: GROUP BY plan at scale. But is it the most efficient? FavoriteBands.
ZFS has many very interesting features, but I am a bit tired of hearing negative statements on ZFS performance. I found the comparison of InnoDB vs. MyISAM quite interesting, and I’ll use it in this post. Linux OS Tuning for MySQL Database Performance. AMD EPYC PerformanceTesting… or Don’t get on the wrong side of SystemD.
Without a doubt, WebPageTest is one of my favourite web performancetesting tools. It's completely free to use and is such a powerful way to test your web pages from different locations all over the world. Tracking scripts, A/B testing and adverts are just a few of the many reasons why you would want to use a 3rd party library.
Without a doubt, WebPageTest is one of my favourite web performancetesting tools. It's completely free to use and is such a powerful way to test your web pages from different locations all over the world. Tracking scripts, A/B testing and adverts are just a few of the many reasons why you would want to use a 3rd party library.
Without a doubt, WebPageTest is one of my favourite web performancetesting tools. It's completely free to use and is such a powerful way to test your web pages from different locations all over the world. Tracking scripts, A/B testing and adverts are just a few of the many reasons why you would want to use a 3rd party library.
It just so happens that we can test the accuracy of the paint timing metrics by comparing them to the Start Render metric in WebPageTest. It calculates the Start Render time by performing a frame-by-frame comparison to find the point at which the first pixels are rendered to the screen. Doing the analysis.
Of all those options, it’s safe to assume that text is the best choice for LCP performance because it loads and renders fast. web.dev’s main content is an image according to LCP (test ran on WebPageTest). Over-using this attribute or running premature optimization might harm performance, so make sure to run performancetests to verify.
This explains the challenges involved in deploying and testing HTTP/3 yourself. In our own early tests , I found seriously diminishing returns at about 40 files. As if that wasn’t enough, another issue will make local testing more difficult: Chrome makes it very difficult for you to use self-signed TLS certificates for QUIC.
In a comment to my article, Marcos Kirchner mentioned that he tested my solution with varying table value constructor cardinalities, and got different execution times for the different cardinalities. Testing different base table cardinalities is just one dimension to try. Let’s proceed to performancetesting.
2 hours for the final result analysis and comparison. The Findings My intention is to build awareness on the performance engineering & monitoring topic and not to blame hard working retail companies. Consider Load & PerformanceTesting in your development process.
This post complements the previous best practice guides this time with the focus on MySQL and MariaDB and achieving top levels of performance with the HammerDB MySQL TPC-C test. InnoDB is the storage engine that will deliver the best OLTP throughput and should be chosen for this test. . HammerDB difference from Sysbench.
In our final post, we will put them head-to-head in a detailed feature comparison and compare the results of PgBouncer vs. Pgpool-II performance for your PostgreSQL hosting ! PerformanceTesting. For good measure, we ran the same tests without a connection pooler too. Testing Conditions. Pgpool-II (on box).
Testing And Monitoring. You can then mimic the 90th percentile’s experience for testing. Alternatively, you can also use Speed Scorecard (also provides a revenue impact estimator), Real User Experience TestComparison or SiteSpeed CI (based on synthetic testing). Now you have something measurable to test against.
Testing And Monitoring. You can then mimic the 90th percentile’s experience for testing. Note : If you use Page Speed Insights (no, it isn’t deprecated), you can get CrUX performance data for specific pages instead of just the aggregates. Now you have something measurable to test against. Table Of Contents. Quick Wins.
We organize all of the trending information in your field so you don't have to. Join 5,000+ users and stay up to date on the latest articles your peers are reading.
You know about us, now we want to get to know you!
Let's personalize your content
Let's get even more personalized
We recognize your account from another site in our network, please click 'Send Email' below to continue with verifying your account and setting a password.


Let's personalize your content