This site uses cookies to improve your experience. To help us insure we adhere to various privacy regulations, please select your country/region of residence. If you do not select a country, we will assume you are from the United States. Select your Cookie Settings or view our Privacy Policy and Terms of Use.
Cookie Settings
Cookies and similar technologies are used on this website for proper function of the website, for tracking performance analytics and for marketing purposes. We and some of our third-party providers may use cookie data for various purposes. Please review the cookie settings below and choose your preference.
Used for the proper function of the website
Used for monitoring website traffic and interactions
Cookie Settings
Cookies and similar technologies are used on this website for proper function of the website, for tracking performance analytics and for marketing purposes. We and some of our third-party providers may use cookie data for various purposes. Please review the cookie settings below and choose your preference.
Strictly Necessary: Used for the proper function of the website
Performance/Analytics: Used for monitoring website traffic and interactions
Here’s how Dynatrace can help automate up to 80% of technical tasks required to manage compliance and resilience: Understand the complexity of IT systems in real time Proactively prevent, prioritize, and efficiently manage performance and security incidents Automate manual and routine tasks to increase your productivity 1.
But to be scalable, they also need low-code/no-code solutions that don’t require a lot of spin-up or engineering expertise. With the Dynatrace modern observability platform, teams can now use intuitive, low-code/no-code toolsets and causal AI to extend answer-driven automation for business, development and security workflows.
Nobody loves to work on legacy code because it can be a confusing endeavor; at best, it’s time-consuming. But do we now live with the huge repercussions and costs of retaining and utilizing legacy codes as they are?
In this article, we analyze the policies of block allocation from the source code. How does an Alluxio worker decide which directory to put a block in when a user reads or writes data through Alluxio?
Developers deserve a seamless way to troubleshoot effectively and gain quick insights into their code to identify issues regardless of when or where they arise. Developers not only write code; they’re also accountable for their applications performance and reliability. Browse your code. It’s easy as 1-2-3 1.
What developers want Developers want to own their code in a distributed, ephemeral, cloud, microservices-based environment. This ownership starts with understanding how their code behaves in all environments, resolving issues, and writing and optimizing code in a high-quality, secure, and timely manner.
SQL Server is a powerful relational database management system (RDBMS), but as datasets grow in size and complexity, optimizing their performance becomes critical. In this article, we will explore how AI can assist in these areas, providing code examples to tackle complex queries.
The IT world is rife with jargon — and “as code” is no exception. “As code” means simplifying complex and time-consuming tasks by automating some, or all, of their processes. Today, the composable nature of code enables skilled IT teams to create and customize automated solutions capable of improving efficiency.
Regarding contemporary software architecture, distributed systems have been widely recognized for quite some time as the foundation for applications with high availability, scalability, and reliability goals. Spring Boot's default codes and annotation setup lessen the time it takes to design an application.
With the increasing amount of sensitive information stored and processed, it’s essential to ensure that systems are secure and protected against potential threats. The deep insights into application code provided by OneAgent® help track potentially vulnerable data flow within an application.
There’s a goldmine of business data traversing your IT systems, yet most of it remains untapped. Most of these leverage the unique capability of Dynatrace OneAgent® to extract business data from in-flight application payloads — without writing any code. To unlock business value, the data must be: Accessible from anywhere.
Log management is an organization’s rules and policies for managing and enabling the creation, transmission, analysis, storage, and other tasks related to IT systems’ and applications’ log data. Distributed cloud systems are complex, dynamic, and difficult to manage without the proper tools. What is log management?
Two weeks ago, Bjarne and I and lots of ISO committee members had a blast at the code::dive C++ conference held on November 25, just two days after the end of the Wrocaw ISO C++ meeting. I use this world’s banking system. I rely on this world’s hospital system. I rely on this world’s power grid.
To orchestrate the different logging services, you use Fluent Bit to forward these logs to your centralized logging system, like Dynatrace. This caused you to lose complete visibility of your containers logs, performance, and error data, and you could not tell if the system was down or not.
Infrastructure as code is a way to automate infrastructure provisioning and management. In this blog, I explore how Dynatrace has made cloud automation attainable—and repeatable—at scale by embracing the principles of infrastructure as code. Infrastructure-as-code. But how does it work in practice? Cloud Automation use cases.
The system is inconsistent, slow, hallucinatingand that amazing demo starts collecting digital dust. Two big things: They bring the messiness of the real world into your system through unstructured data. When your system is both ingesting messy real-world data AND producing nondeterministic outputs, you need a different approach.
Discover how Livi navigated the complexities of transitioning MJog, a legacy healthcare system, to a cloud-native architecture, sharing valuable insights for successful tech modernization. Our experience illustrates that transitioning from legacy systems to cloud-based microservices is not a one-time project but an ongoing journey.
On the other hand, deploying new code on the backend is complex and offers no such transparency. With Dynatrace Live Debugger, you can set a non-breaking breakpoint and instantly see if new code is following the intended new paths, if any new arguments are being considered, and if input and output arguments are aligned with expectations.
Failures in a distributed system are a given, and having the ability to safely retry requests enhances the reliability of the service. Implementing idempotency would likely require using an external system for such keys, which can further degrade performance or cause race conditions.
Clearly, continuing to depend on siloed systems, disjointed monitoring tools, and manual analytics is no longer sustainable. This enables proactive changes such as resource autoscaling, traffic shifting, or preventative rollbacks of bad code deployment ahead of time.
In this case, the main stakeholders are: - Title Launch Operators Role: Responsible for setting up the title and its metadata into our systems. In this context, were focused on developing systems that ensure successful title launches, build trust between content creators and our brand, and reduce engineering operational overhead.
Many of these projects are under constant development by dedicated teams with their own business goals and development best practices, such as the system that supports our content decision makers , or the system that ranks which language subtitles are most valuable for a specific piece ofcontent.
This vulnerability, published as CVE-2024-53677 on December 11, 2024, affects the file upload mechanism, allowing for path traversal and potential remote code execution. Our detailed analysis not only illuminates the specifics of CVE-2024-53677 but also offers practical measures to secure your software systems against similar threats.
It doesn’t matter if you need typically used failure-rate or response-time metrics to ensure your system’s availability and performance or if you need to rely on abnormal log drops to gain insights into raising problems—SLOs leveraged with Grail provide all the information you need.
Whether you’re troubleshooting a specific issue or looking to improve overall system performance, Distributed tracing equips you with the tools you need to make informed decisions and maintain a high standard of application performance. To understand the benefits of the Distributed Tracing app, let’s take a look at a typical scenario.
Amazon Bedrock , equipped with Dynatrace Davis AI and LLM observability , gives you end-to-end insight into the Generative AI stack, from code-level visibility and performance metrics to GenAI-specific guardrails. Any error codes or guardrail triggers. Youve found the why without manually spelunking logs in disparate systems.
Heres more about the VMware security advisory and how you can quickly find affected systems using Dynatrace so you canautomate remediation efforts. With a TOCTOU vulnerability, an attacker can manipulate a system between the time a resource’s state is checked and when it’s used, also known as a race condition.
Behind the scenes, a myriad of systems and services are involved in orchestrating the product experience. These backend systems are consistently being evolved and optimized to meet and exceed customer and product expectations. This technique facilitates validation on multiple fronts.
For the CrowdStrike issue, one can use both monitored Windows System logs and the Dynatrace entity model to find out what servers are impacted. The following is an example of a query using the Dynatrace Query Language (DQL) to find out when BSOD issues are being written to Windows System logs.
Broken Apache Struts 2: Technical Deep Dive into CVE-2024-53677The vulnerability allows attackers to manipulate file upload parameters, possibly leading to remote code execution. Applications must migrate to the new mechanism, as using the deprecated file upload mechanism leaves systems vulnerable. While Struts version 6.4.0
Software bugs Software bugs and bad code releases are common culprits behind tech outages. These issues can arise from errors in the code, insufficient testing, or unforeseen interactions among software components. Ransomware encrypts essential data, locking users out of systems and halting operations until a ransom is paid.
Due to its versatility for storing information in both structured and unstructured formats, PostgreSQL is the fourth most used standard in modern database management systems (DBMS) worldwide 1. Offering comprehensive access to files, software features, and the operating system in a more user-friendly manner to ensure control.
This is where large-scale system migrations come into play. By tracking metrics only at the level of service being updated, we might miss capturing deviations in broader end-to-end system functionality. Canaries and sticky canaries are valuable tools in the system migration process.
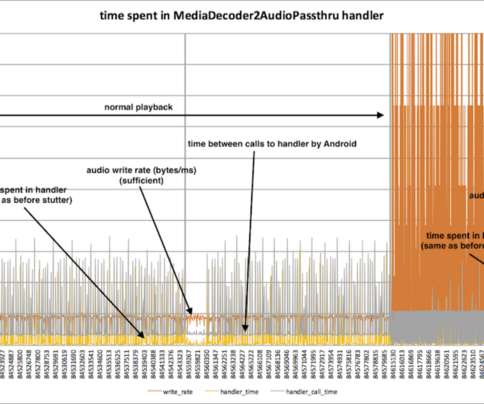
All four players involved in the device were on the call: there was the large European pay TV company (the operator) launching the device, the contractor integrating the set-top-box firmware (the integrator), the system-on-a-chip provider (the chip vendor), and myself (Netflix). Next I started reading the Ninja source code.
Modern observability and security require comprehensive access to your hosts, processes, services, and applications to monitor system performance, conduct live debugging, and ensure application security protection. Changes are introduced on a controlled schedule, typically once a week, to reduce the risk of affecting customer systems.
When organizations move toward the cloud, their systems also lean toward distributed architectures. You need to find the right tools to monitor, track and trace these systems by analyzing outputs through metrics, logs, and traces. One of the most common examples is the adoption of microservices.
New: identify hotspots with the honeycomb visualization Honeycombs are great for visualizing health in complex and distributed systems, enabling you to visualize countless entities effectively and at scale. Use color coding to tell a story. Try different cell shapes.
Indeed, according to one survey, DevOps practices have led to 60% of developers releasing code twice as quickly. But increased speed creates a tradeoff: According to another study, nearly half of organizations consciously deploy vulnerable code because of time pressure. Increased adoption of Infrastructure as code (IaC).
Sometimes overlooked is a fourth category we might call long-tail processes; these are the ad hoc or custom workflows that develop in response to gaps between systems, applications, departments, or workflows. Log files and APIs are the most common business data sources, and software agents may offer a simpler no-code option.
That’s why many organizations are turning to generative AI—which uses its training data to create text, images, code, or other types of content that reflect its users’ natural language queries—and platform engineering to create new efficiencies and opportunities for innovation. No one will be around who fully understands the code.
Whether deployment of a new system, a new release, or a rolling patch update, I wanted it done consistently and successfully every time. Years later, a few configuration management solutions came into play that required heavy amounts of coding, but proved that the industry was moving toward compartmentalized automation solutions.
The Qualys Threat Research Unit (TRU) has discovered a Remote Unauthenticated Code Execution (RCE) vulnerability in OpenSSH server (sshd) in glibc-based Linux systems. This can result in a complete system takeover, malware installation, data manipulation, and the creation of backdoors for persistent access.
As dynamic systems architectures increase in complexity and scale, IT teams face mounting pressure to track and respond to conditions and issues across their multi-cloud environments. How do you make a system observable? Dynatrace news. But what is observability? Why is it important, and what can it actually help organizations achieve?
The article, titled “ K8s celebrates KuberTENes: A decade of working together ,” applauds the collective efforts of more than 88,000 members of a committed community who have offered code and insight to improve Kubernetes.
We organize all of the trending information in your field so you don't have to. Join 5,000+ users and stay up to date on the latest articles your peers are reading.
You know about us, now we want to get to know you!
Let's personalize your content
Let's get even more personalized
We recognize your account from another site in our network, please click 'Send Email' below to continue with verifying your account and setting a password.


Let's personalize your content