This site uses cookies to improve your experience. To help us insure we adhere to various privacy regulations, please select your country/region of residence. If you do not select a country, we will assume you are from the United States. Select your Cookie Settings or view our Privacy Policy and Terms of Use.
Cookie Settings
Cookies and similar technologies are used on this website for proper function of the website, for tracking performance analytics and for marketing purposes. We and some of our third-party providers may use cookie data for various purposes. Please review the cookie settings below and choose your preference.
Used for the proper function of the website
Used for monitoring website traffic and interactions
Cookie Settings
Cookies and similar technologies are used on this website for proper function of the website, for tracking performance analytics and for marketing purposes. We and some of our third-party providers may use cookie data for various purposes. Please review the cookie settings below and choose your preference.
Strictly Necessary: Used for the proper function of the website
Performance/Analytics: Used for monitoring website traffic and interactions
Site reliability engineering (SRE) plays a vital role in ensuring Java applications' high availability, performance, and scalability. Each section will be illustrated with relevant Javacode samples to provide practical insights.
CPU spikes are one of the most common performance challenges faced by Java applications. While traditional APM (Application Performance Management) tools provide high-level insights into overall CPU usage, they often fall short of identifying the root cause of the spike.
As a Software Engineer, the mind is trained to seek optimizations in every aspect of development and ooze out every bit of available CPU Resource to deliver a performing application. Recently, I spent some time checking on the Performance (not a very detailed study) of the various programming languages. Ahem, Slow!
All-new Dynatrace code-level vulnerability detection All-new Dynatrace code-level vulnerability detection evaluates all requests passing through your applications to identify vulnerabilities. The deep insights into application code provided by OneAgent® help track potentially vulnerable data flow within an application.
We decided to move one of our Java microservices?—?let’s In both bands, performance characteristics remain consistent for the entire uptime of the JVM on the node, i.e. nodes never jumped the bands. Luckily, the m5.12xl instance type exposes a set of core PMCs (Performance Monitoring Counters, a.k.a. let’s call it GS2?—?to
In the realm of Java development, optimizing the performance of applications remains an ongoing pursuit. Profile-Guided Optimization (PGO) stands as a potent technique capable of substantially enhancing the efficiency of your Java programs.
Let's start with Zoom, an incredible video-conferencing application on which almost today's world relies on was developed using JAVA and C++. The second example will be a food ordering application that again depends on several different coded script lines.
As this was the first time in years that systems started to experience major disruption a team of performance experts was gathered who were quick to identify: Root cause : Old way of using XPath (full search). It can be your own code, 3 rd party code or your runtime that executes for certain tasks such as Garbage Collection.
Learn how to make your Java applications performance perfectly. You may also like: How to Properly Plan JVM Performance Tuning. While Performance Tuning an application both Code and Hardware running the code should be accounted for. Reduce the amount of code in critical sections. Thread Contention.
The IT world is rife with jargon — and “as code” is no exception. “As code” means simplifying complex and time-consuming tasks by automating some, or all, of their processes. Today, the composable nature of code enables skilled IT teams to create and customize automated solutions capable of improving efficiency.
We will also discuss code coverage, mocking dependencies, and overall testing strategies. Generally, a unit should be a small part of the application — in Java, it is often a single class. Generally, a unit should be a small part of the application — in Java, it is often a single class. What is Unit Testing?
You may already know that JUnit and Mockito are two of the most popular testing libraries for Java applications, and you will find them in almost every Java application classpath. I often meet and work with Java developers who know Java well but haven't written a single unit test.
Our Cluster Performance Engineering Team in collaboration with our Autonomous Cloud Enablement (ACE) and development teams quickly identified the root cause and fixed the problem in no time! And the code-level root cause information is what makes troubleshooting easy for developers. Step 3: Identifying root-cause in code.
Java Memory Management, with its built-in garbage collection, is one of the language’s finest achievements. — Excerpt from How Garbage Collection works in the Dynatrace Performance eBook) . . — Excerpt from How Garbage Collection works in the Dynatrace Performance eBook) . Dynatrace news.
Fully automated code-level visibility. Apart from its best-in-class observability capabilities like distributed traces, metrics, and logs, Dynatrace OneAgent additionally provides automatic deep code-level insights for Java,NET, Node.js, PHP, and Golang, without the need to change any application code or configuration.
As a Java Developer, we need to cover a lot of scenarios to ensure the quality of our software and catch bugs as soon as possible when introducing a new code. The answer which the community provided works well, but it is a lot of boilerplate code to just assert your log events. So the LogCaptor library came into life.
While I was coding for a performance back-end competition , I tried a couple of tricks, and I was wondering if there was a faster validator for Java applications, so I started a sample application. I used a very simple scenario: just validate the user's email.
While we are hearing tips on Clean code, the most common tip is maintaining SRP while writing class or methods, in a broader scope Module/Package/Service/API. Most of the time it succumbs us and we are ending up with anti-KISS code but If we use it in the right proportion, then we can create a cohesive and robust architecture.
No trials, no license purchases – just the tools you need to delve behind the scenes of your code execution. What Are Java Profilers? A Java Profiler is a tool that monitors Java bytecode constructs and operations at the JVM level. They all come for a very affordable price: free.
Blocking code is code which blocks executing threads until their operations finish. This article assumes some basic knowledge about the differences between blocking and non-blocking code.
These days, our code frequently has to reach out to a remote server as part of its job, usually consuming an API or some other service. Frequently, our code communicates with these remote services in a RESTful manner. Introduction.
AWS Lambda is a compute service that lets you run code without any infrastructure management and it natively supports Java, Go, NodeJS,Net, Python, and Ruby runtimes.
For years, the debate has raged on regarding which programming language is better, Java or Scala. While some argue that just because Java is older it is better, others believe Scala is better for a variety of reasons. In essence, Java is classified as an object oriented programming language. The Size and Quality of the Code.
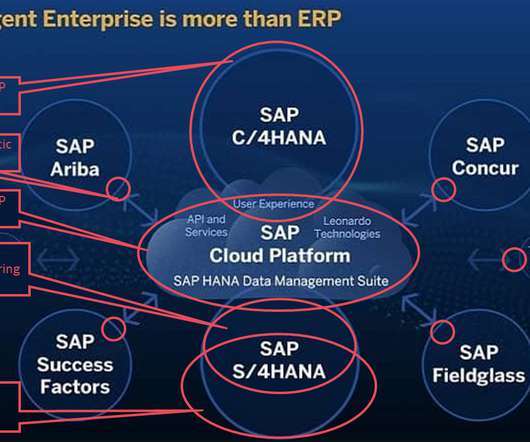
When you ask performance management vendors, “Does your solution work with SAP?,” Do you provide support for application technologies from ABAP through Java to HANA ? Digital Experience Management from Dynatrace delivers performance management to SAP Fiori UI users at many enterprises. Dynatrace news.
PySpark is the Python API for Apache Spark , which allows Python developers to write Spark applications using Python instead of Scala or Java. In addition, pySpark applications can be tuned to optimize performance and achieve better execution time, scalability, and resource utilization.
They enable product delivery and SRE teams to turn functionality on and off at runtime without deploying new code. This helps SRE teams quickly mitigate issues by turning off poorly-performing features, enabling features for specific subsets of end-users, or performing side-by-side A/B feature testing.
For this blog post I want to focus on how you can leverage Dynatrace to get a lot of insight into your plugin code. While working on the integration with Juniper I managed to resolve several bugs and achieve a major performance improvement. Part 1 – The code as it stood. Part 2 – Instrumenting the code.
Dynatrace provides automatic and intelligent observability without touching any code through auto-instrumentation, thereby helping you to better understand potential issues that may impact your end users’ experience. All improvements are available with OneAgent version 1.217.
Why Do We Need a SQL Performance Review? The current code review process is manual and doesn’t capture the Explain Plan for all modified queries. To provide performance audits with data points. Generate a report with queries which could impact performance.
One of the best tools we have today for understanding application behavior and troubleshooting performance issues are Java profilers. How Java Profilers Work. Profilers inspect the state of a JVM either by passively listening for events from the JVM or by actively querying the JVM for its state.
Capturing the console output and using that to assert isn't that hard in plain java. So I decided to generate a library out of it and contribute back to the community to give them also the possibility of capturing the console output without introducing verbose code. It is actually very easy but verbose.
In May 2023 the critical vulnerability CVE-2020-36641 in the Java library aXMLRPC was published in the National Vulnerability Database (NVD). XML external entity (XXE) exploit The aXMLRPC library allows its users to connect to a server and perform RPC calls using the XML-RPC protocol over HTTP.
Risks include performance problems and outages in cloud-native environments, application security vulnerabilities and poor digital experience for customers and other users. Open source code, for example, has generated new threat vectors for attackers to exploit. But with this speed, agility, and innovation come new challenges.
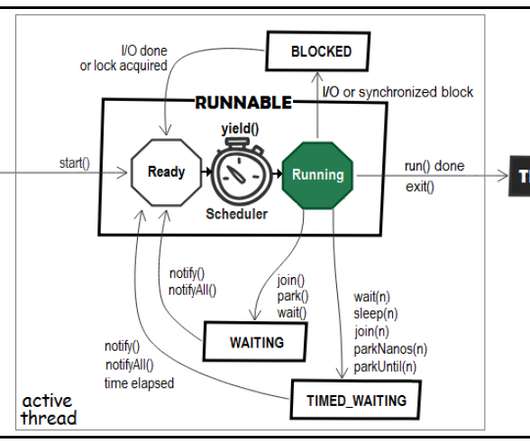
Read on to find out some Java technical interview questions! Almost any Java technical interview contains several questions covering Java concurrency topics. A common scenario for a beginner-intermediate level sound like this: Interviewer: Can you enumerate the Java thread life cycle states?
focused on technology coverage, building on the flexibility of JMX for Java and Python-based coded extensions for everything else. While Python code can address most data acquisition and ingest requirements, it comes at the cost of complexity in implementation and use-case modeling. Dynatrace Extensions 1.0 Extensions 2.0
Data analysis within large and highly dynamic microservices environments is the biggest challenge that Application Performance Monitoring (APM) vendors face today. Dynatrace has been building automated application instrumentation—without the need to modify source code—for over 15 years already. This approach doesn’t always work.
The green frames are the actual instructions running on the AI or GPU accelerator, aqua shows the source code for these functions, and red (C), yellow (C++), and orange (kernel) show the CPU code paths that initiated these AI/GPU programs. The gray "-" frames just help highlight the boundary between CPU and AI/GPU code.
Advanced Features: Does the tool support stored procedures, triggers, indexing, and performance analysis? Cons: Slow performance when handling large datasets or complex queries. Cons: Slow performance when handling large datasets or complex queries. Pros: Powerful query editor with intelligent code completion.
Successful deployments of cloud-native workloads at the edge help to reduce costs, boost performance, and improve customer experience. By drilling down further on the workload level, you can gain valuable insights into the performance and potential problems of any containerized workload.
As organizations struggle to combat vulnerabilities in their IT environments, they need real-time data on performance problems and security issues. At the annual conference Dynatrace Perform 2022, the theme is “Empowering the game changers.” Perform 2022 conference coverage , check out our guide. Dynatrace news.
In cloud-native application stacks, everything is code. Dynatrace entered the Application Security market with automatic and continuous protection for Java workloads. and Java are the most popular languages within Kubernetes environments. Automatic vulnerability detection for Kubernetes platform versions. Next steps.
AI model observability plays a crucial role in achieving this by addressing these key aspects: Model performance and reliability: Evaluating the model’s ability to provide accurate and timely responses, ensuring stability, and assessing domain-specific semantic accuracy. Maintained under the Apache 2.0
If you already have an application running in Kubernetes and are exploring using OpenTelemetry to gain insights into the health and performance of your app and cluster, you might be interested in an implementation of the Kubernetes Operator called the OpenTelemetry Operator. Learn more about zero-code instrumentation at this link.
According to the 2022 CISO Research Report , only 25% of respondents’ security teams “can access a fully accurate, continuously updated report of every application and code library running in production in real-time.” Undetected, the compromised code could allow attackers to access data they’re not authorized to have.
We organize all of the trending information in your field so you don't have to. Join 5,000+ users and stay up to date on the latest articles your peers are reading.
You know about us, now we want to get to know you!
Let's personalize your content
Let's get even more personalized
We recognize your account from another site in our network, please click 'Send Email' below to continue with verifying your account and setting a password.


Let's personalize your content