This site uses cookies to improve your experience. To help us insure we adhere to various privacy regulations, please select your country/region of residence. If you do not select a country, we will assume you are from the United States. Select your Cookie Settings or view our Privacy Policy and Terms of Use.
Cookie Settings
Cookies and similar technologies are used on this website for proper function of the website, for tracking performance analytics and for marketing purposes. We and some of our third-party providers may use cookie data for various purposes. Please review the cookie settings below and choose your preference.
Used for the proper function of the website
Used for monitoring website traffic and interactions
Cookie Settings
Cookies and similar technologies are used on this website for proper function of the website, for tracking performance analytics and for marketing purposes. We and some of our third-party providers may use cookie data for various purposes. Please review the cookie settings below and choose your preference.
Strictly Necessary: Used for the proper function of the website
Performance/Analytics: Used for monitoring website traffic and interactions
Site reliability engineering (SRE) plays a vital role in ensuring Java applications' high availability, performance, and scalability. This discipline merges software engineering and operations, aiming to create a robust infrastructure that supports seamless user experiences.
The IT world is rife with jargon — and “as code” is no exception. “As code” means simplifying complex and time-consuming tasks by automating some, or all, of their processes. Today, the composable nature of code enables skilled IT teams to create and customize automated solutions capable of improving efficiency.
By open-sourcing the project, we hope to contribute to the Java and GraphQL communities and learn from and collaborate with everyone who will be using the framework to make it even better in the future. The transition to the new federated architecture meant that many of our backend teams needed to adopt GraphQL in our Java ecosystem.
AWS Lambda is a compute service that lets you run code without any infrastructure management and it natively supports Java, Go, NodeJS,Net, Python, and Ruby runtimes.
Indeed, according to one survey, DevOps practices have led to 60% of developers releasing code twice as quickly. But increased speed creates a tradeoff: According to another study, nearly half of organizations consciously deploy vulnerable code because of time pressure. Increased adoption of Infrastructure as code (IaC).
Fully automatic deep code monitoring module injection. One of the unique strengths of Dynatrace OneAgent is the fully automated injection of the deep code monitoring module on Windows and Linux. Fully automated deep code monitoring module injection is available for all customers as of OneAgent version 1.175. This is why AIX 6.1
Since December 10, days after a critical vulnerability known as Log4Shell was discovered in servers supporting the game Minecraft, millions of exploit attempts have been made of the Log4j 2 Java library, according to one team tracking the impact, with potential threat to millions more applications and devices across the globe.
It removes the burden of managing underlying infrastructure and is broadly adopted for cloud-native application environments. Dynatrace provides automatic and intelligent observability without touching any code through auto-instrumentation, thereby helping you to better understand potential issues that may impact your end users’ experience.
Cloud migration enables IT teams to enlist public cloud infrastructure so an organization can innovate without getting bogged down in managing all aspects of IT infrastructure as it scales. They need ways to monitor infrastructure, even if it’s no longer on premises. Right-sizing infrastructure. Repurchase.
DevOps teams, SREs (site reliability engineers), platform teams, and SecOps teams aren’t always working from a common source of truth: SAST tools (static application security testing) provide scanning code for vulnerabilities. Dynatrace extends its Runtime Vulnerability Analysis to Go on top of Java ,NET , Node.js
Although IT teams are thorough in checking their code for any errors, an attacker can always discover a loophole to exploit and damage applications, infrastructure, and critical data. Malicious actors can execute any code on the attacked system, for example, to access sensitive configuration data.
Fully automated code-level visibility. Apart from its best-in-class observability capabilities like distributed traces, metrics, and logs, Dynatrace OneAgent additionally provides automatic deep code-level insights for Java,NET, Node.js, PHP, and Golang, without the need to change any application code or configuration.
In cloud-native application stacks, everything is code. You need to go deeper into the stack — into the infrastructure itself. Dynatrace entered the Application Security market with automatic and continuous protection for Java workloads. and Java are the most popular languages within Kubernetes environments.
They can develop software applications rapidly and gain access to extensible cloud resources without having to sink costs into IT plumbing or managing this infrastructure themselves. Open source code, for example, has generated new threat vectors for attackers to exploit. Learn what Spring4Shell is and how to detect and mitigate it.
Dynatrace has been building automated application instrumentation—without the need to modify source code—for over 15 years already. Driving the implementation of higher-level APIs—also called “typed spans”—to simplify the implementation of semantically strong tracing code. This approach doesn’t always work.
Dynatrace has offered a Lambda code module for Node.js This has led to the recent release of our new Lambda monitoring extension supporting Node.js, Java, and Python. This is another measure to evenly redistribute the load within the AWS Lambda infrastructure. file uploaded to AWS Lambda. The Lambda execution life cycle.
GKE Autopilot empowers organizations to invest in creating elegant digital experiences for their customers in lieu of expensive infrastructure management. These CSI pods provide a unique way of solving a handful of infrastructure problems. Agent logs security. The CSI pod is mounted to application pods using an overlay file system.
At Dynatrace, where we provide a software intelligence platform for hybrid environments (from infrastructure to cloud) we see a growing need to measure how mainframe architecture and the services running on it contribute to the overall performance and availability of applications. Full-stack and cloud-infrastructure monitoring modes.
The Dynatrace ® unified observability and security platform addresses the needs of enterprise-edge scenarios by managing the health and performance of containerized applications and multi-cloud infrastructures with metrics, traces, and logs in one place. Seeing is believing You can find out more about Dynatrace and Red Hat here.
This is particularly vital for securing observability solutions like Dynatrace® Kubernetes infrastructure observability, application observability, and Application Security. Ensuring immutability—coupled with thorough scanning and strict verification—is crucial for any container entering Kubernetes clusters.
Code changes are often required to refine observability data. This results in site reliability engineers nudging development teams to add resource attributes, endpoints, and tokens to their source code. Thus, measuring application performance becomes an unnecessarily frustrating coordination effort between teams.
focused on technology coverage, building on the flexibility of JMX for Java and Python-based coded extensions for everything else. While Python code can address most data acquisition and ingest requirements, it comes at the cost of complexity in implementation and use-case modeling. Dynatrace Extensions 1.0 Extensions 2.0
The vulnerability is located in Log4j 2, an open-source Apache Java software used to run logging services in a host of front-end and backend applications. A real-time observability platform with code-level application insights can automatically identify vulnerabilities in runtime and production environments.
For IT infrastructure managers and site reliability engineers, or SREs , logs provide a treasure trove of data. These traditional approaches to log monitoring and log analytics thwart IT teams’ goal to address infrastructure performance problems, security threats, and user experience issues. where an error occurred at the code level.
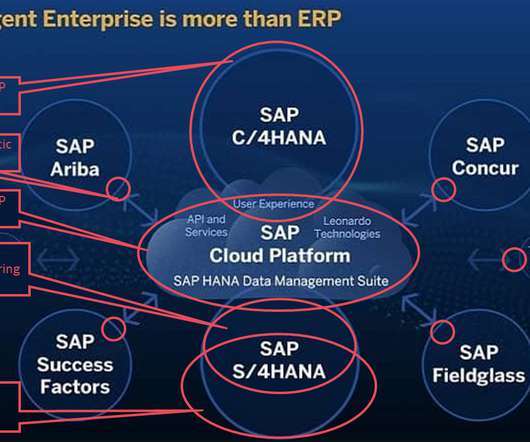
This means that you should ask the following: Does your monitoring solution work with SAP both on-premise and within cloud infrastructure ? Do you provide support for application technologies from ABAP through Java to HANA ? Get AI-powered answers about your SAP infrastructure across cloud-native and hybrid environments.
According to the 2022 CISO Research Report , only 25% of respondents’ security teams “can access a fully accurate, continuously updated report of every application and code library running in production in real-time.” Undetected, the compromised code could allow attackers to access data they’re not authorized to have.
Teams are embracing new technologies and continuously deploying code. But what if you could see what’s running in production in real-time, continuously analyzing all services for vulnerabilities, and prioritizing those based on what code is called? They also can’t provide deep insights unless you have source code access.
On the Android team, while most of our time is spent working on the app, we are also responsible for maintaining this backend that our app communicates with, and its orchestration code. Image taken from a previously published blog post As you can see, our code was just a part (#2 in the diagram) of this monolithic service. Java…Script?
In fact, according to the recent Dynatrace survey, “ The state of AI 2024 ,” 95% of technology leaders are concerned that using generative AI to create code could result in data leakage and improper or illegal use of intellectual property. In this blog, Carolyn Ford recaps her discussion with Tracy Bannon about AI in the workplace.
AWS Fargate is the exception to this rule: with the AWS serverless compute engine, paired with Dynatrace intelligent observability for Kubernetes, customers can forgo the complex burden of managing and monitoring their own server infrastructure. and Golang containers. Activate intelligent observability on EKS for Fargate today!
Developers use generative AI to find errors in code and automatically document their code. They can also use generative AI for cybersecurity, write prototype code, and implement complex software systems. But as the Black Hat 2023 agenda indicates, generative AI also introduces new security risks. A new CISO report explains why.
They also care about infrastructure: SREs require system visibility and incident management. But developers need code-level visibility and code-level data.” That’s not how I envision code-level observability,” Laifenfeld said. You won’t need to know Kubernetes to understand what’s going on with your code in Kubernetes.”
The first step is determining whether the problem originates from the application or the underlying infrastructure. Learn how Linux kernel instrumentation can improve your infrastructure observability with deeper insights and enhanced monitoring. One issue that often complicates this process is the "noisy neighbor" problem.
Artisan Crafted Images In the Netflix full cycle DevOps culture the team responsible for building a service is also responsible for deploying, testing, infrastructure, and operation of that service. We now have the software and instance configuration as code. This means changes can be tracked and reviewed like any other code change.
In recent years, function-as-a-service (FaaS) platforms such as Google Cloud Functions (GCF) have gained popularity as an easy way to run code in a highly available, fault-tolerant serverless environment. GCF also enables teams to run custom-written code to connect multiple services in Node, Python, Go, Java,NET, Ruby, and PHP.
Lack of context —most vulnerability scanners don’t provide runtime context and key information like whether vulnerable code is used at runtime. Starting with Dynatrace version 1.225 and OneAgent version 1.207, you can detect runtime vulnerabilities and assess risks across Java, Node.js,NET, How to get started.
Impact : This issue affects only those extensions that use native libraries called from Python code distributed with the extension. Infrastructure Monitoring. Settings > Anomaly detection > Infrastructure. Infrastructure Monitoring. Infrastructure Monitoring. Extension-specific advisory. Dynatrace API.
Other distributions like Debian and Fedora are available as well, in addition to other software like VMware, NGINX, Docker, and, of course, Java. This is especially the case with microservices and applications created around multiple tiers, where cheaper hardware alternatives play a significant role in the infrastructure footprint.
In addition to world-class Dynatrace Kubernetes workload and cluster monitoring for DevOps teams, application teams gain tremendous value with Dynatrace Pure-Path and deep code-level visibility into the performance of Kubernetes pods running Java,NET, PHP, Node.js, and Golang containers. What’s ahead.
Text-based records of events and activities generated by applications and infrastructure components. Instrumentation involves adding code to your application to collect this tracking information, akin to installing security cameras in a store to monitor customer movement and behavior.
This real-time visibility, as well as proven code-level analysis from cloud to the mainframe, gives enterprises a huge competitive advantage—they can eliminate inefficiencies and consequently, innovate at a faster rate. Easily achieve a cost-effective IBM Z configuration by monitoring relevant infrastructure metrics. Prerequisites.
Just a single OneAgent per host is required to collect all relevant monitoring data, all the way down to specific lines of code. Virtualization can be a key player in your process’ performance, and Dynatrace has built-in integrations to bring metrics about the Cloud Infrastructure into your Dynatrace environment.
OSS is a faster, more collaborative, and more flexible way of driving software innovation than proprietary-only code. Especially those operating in critical infrastructure sectors such as oil and gas, telecommunications, and energy. The figures speak for themselves: 80% of organizations increased their OSS use in 2022.
With Dynatrace’s full-stack monitoring capabilities, organizations can assess how underlying infrastructure resources affect the application’s performance. Figure 2 – Host VM Utilization dashboard to assess for Capacity and Infrastructure Cost Optimization management. Operational excellence. Let’s look at an example.
We organize all of the trending information in your field so you don't have to. Join 5,000+ users and stay up to date on the latest articles your peers are reading.
You know about us, now we want to get to know you!
Let's personalize your content
Let's get even more personalized
We recognize your account from another site in our network, please click 'Send Email' below to continue with verifying your account and setting a password.


Let's personalize your content