This site uses cookies to improve your experience. To help us insure we adhere to various privacy regulations, please select your country/region of residence. If you do not select a country, we will assume you are from the United States. Select your Cookie Settings or view our Privacy Policy and Terms of Use.
Cookie Settings
Cookies and similar technologies are used on this website for proper function of the website, for tracking performance analytics and for marketing purposes. We and some of our third-party providers may use cookie data for various purposes. Please review the cookie settings below and choose your preference.
Used for the proper function of the website
Used for monitoring website traffic and interactions
Cookie Settings
Cookies and similar technologies are used on this website for proper function of the website, for tracking performance analytics and for marketing purposes. We and some of our third-party providers may use cookie data for various purposes. Please review the cookie settings below and choose your preference.
Strictly Necessary: Used for the proper function of the website
Performance/Analytics: Used for monitoring website traffic and interactions
In recent years, function-as-a-service (FaaS) platforms such as Google Cloud Functions (GCF) have gained popularity as an easy way to run code in a highly available, fault-tolerant serverless environment. What is Google Cloud Functions? GCF is part of the Google Cloud Platform. How Google Cloud Functions works.
As a leader in cloud infrastructure and platform services , the Google Cloud Platform is fast becoming an integral part of many enterprises’ cloud strategies. However, as businesses migrate to the Google Cloud Platform, they’re faced with even more complex, distributed environments that are inherently difficult to observe and operate.
In the webinar “ Intelligent Kubernetes observability and automation ,” Dynatrace expert Henrik Rexed and GCP experts Gari Singh and Alisha Stull provide insights into leveraging AI-powered observability and automation to gain granular insights into Kubernetes environments on Google Cloud Platform at an enterprise scale.
In IT and cloud computing, observability is the ability to measure a system’s current state based on the data it generates, such as logs, metrics, and traces. DevSecOps teams can tap observability to get more insights into the apps they develop, and automate testing and CI/CD processes so they can release better quality code faster.
Dynatrace industry-leading tracing, metrics, and log ingestion provide the level of high fidelity data that teams need to make accurate predictions about capacity. Because OneAgent automatically detects service endpoints and stitches requests together, it doesn’t require that developers manually write trace code.
Cloud-native observability for Google’s fully managed GKE Autopilot clusters demands new methods of gathering metrics, traces, and logs for workloads, pods, and containers to enable better accessibility for operations teams. First, we create a small Kubernetes cluster in the Google Cloud Console.
The emerging concepts of working with DevOps metrics and DevOps KPIs have really come a long way. DevOps metrics to help you meet your DevOps goals. Like any IT or business project, you’ll need to track critical key metrics. Here are nine key DevOps metrics and DevOps KPIs that will help you be successful.
Metrics matter. But without complex analytics to make sense of them in context, metrics are often too raw to be useful on their own. To achieve relevant insights, raw metrics typically need to be processed through filtering, aggregation, or arithmetic operations. Examples of metric calculations. Dynatrace news.
This enables proactive changes such as resource autoscaling, traffic shifting, or preventative rollbacks of bad code deployment ahead of time. It also helps to have access to OpenTelemetry, a collection of tools for examining applications that export metrics, logs, and traces for analysis.
With Dynatrace, you can also validate your findings against Real User Monitoring data or even drill down to the code level to pinpoint the root cause of a change in performance. Recently introduced improvements to Visually complete and new web performance metrics for Real User Monitoring are now available for Synthetic Monitoring as well.
Loosely defined, observability is the ability to understand what’s happening inside a system from the knowledge of the external data it produces, which are usually logs, metrics, and traces. Logs, metrics, and traces make up the bulk of all telemetry data. Then, Google made the OpenCensus project open source in 2018.
Thats why Dynatrace will make its AI-powered, unified observability platform generally available on Google Cloud for all customers later this year. Starting in May, selected customers will get to experience all the latest Dynatrace platform features, including the Grail data lakehouse, Davis AI, and unrivaled log analytics, on Google Cloud.
Metrics that offer measurable, repeatable insight into the user experience from the moment they arrive on a website from a mobile or desktop device. Great user experiences start with Core Web Vitals (CWVs) — a set of metrics defined by Google to help measure user experience at scale. When do these metrics matter?
Welcome back to the second part of our blog series on how easy it is to get enterprise-grade observability at scale in Dynatrace for your OpenTelemetry custom metrics. In Part 1 , we announced our new OpenTelemetry custom-metric exporters that provide the broadest language coverage on the market, including Go , .NET record(value); }.
I never thought I’d write an article in defence of DOMContentLoaded , but here it is… For many, many years now, performance engineers have been making a concerted effort to move away from technical metrics such as Load , and toward more user-facing, UX metrics such as Speed Index or Largest Contentful Paint. Or are they…?
Annie leads the Chrome Speed Metrics team at Google, which has arguably had the most significant impact on web performance of the past decade. It's really important to acknowledge that none of this would have been possible without the great work from Annie and her small-but-mighty Speed Metrics team at Google.
Historically, I’d maybe look at Google Analytics—or a RUM solution if the client had one already—but this is only useful for showing me particular outliers, and not necessarily any patterns across the whole project. Any time you run a test with WebPageTest, you’ll get this table of different milestones and metrics. See entry 6.
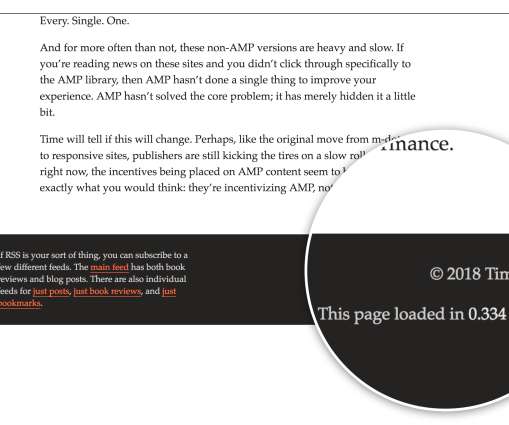
I was browsing Tim Kadlec’s website and I noticed he had added page load time metrics in the footer. Stoyan Stefanov also realized and wrote “This page loaded in X seconds” , a blog post describing the code used for this. First Paint and First Contentful Paint Page load time is a metric that tells us part of the story.
These functions are executed by a serverless platform or provider (such as AWS Lambda, Azure Functions or Google Cloud Functions) that manages the underlying infrastructure, scaling and billing. Observability is typically achieved by collecting three types of data from a system, metrics, logs and traces.
Just as people use Xerox as shorthand for paper copies and say “Google” instead of internet search, Docker has become synonymous with containers. These tools integrate tightly with code repositories (such as GitHub) and continuous integration and continuous delivery (CI/CD) pipeline tools (such as Jenkins). What is Docker?
Symptoms : No data is provided for affected metrics on dashboards, alerts, and custom device pages populated by the affected extension metrics. Impact : This issue affects only those extensions that use native libraries called from Python code distributed with the extension. Linux: Google Container-Optimized OS 81 LTS.
And how can you verify this performance consistently across a multicloud environment that also uses Microsoft Azure and Google Cloud Platform frameworks? Using an interactive no/low code editor, you can create workflows or configure them as code. which shows your operational efficiency in your software delivery pipeline.
It sits at the very beginning of the process before the code is written and can save an immense amount of time down the road (of somebody spending tons of time just to get to a dead-end). I really like what one of the smartest people with whom I worked said: “A good design is a design where you can see the code”. Important note.
In fact, giants like Google and Microsoft once employed monolithic architectures almost exclusively. One large team generally maintains the source code in a centralized repository that’s visible to all engineers, who commit their code in a single build. With monolithic architecture, components all coexist in a single deployment.
Developers want to write high-quality code and deploy it quickly. Keptn: A reference implementation of Google’s SRE principles. One particular use case for Austrian banking software developer Raiffeisen involves using Keptn to automate the production release and readiness validation of all its products using scoring metrics.
How To Use Google CrUX To Analyze And Compare The Performance Of JS Frameworks. How To Use Google CrUX To Analyze And Compare The Performance Of JS Frameworks. As I previously mentioned, my primary data source for this analysis is Google CrUX. Starting in June 2021, these metrics have become a ranking factor for Google search.
These are just a fraction of the technology buzzwords you’ll find as you Google your way around the internet. Loosely defined, Observability boils down to inferring the internal health and state of a system by looking at the external data it produces, which most commonly are logs, metrics, and traces. Dynatrace news.
Leveraging cloud-native technologies like Kubernetes or Red Hat OpenShift in multicloud ecosystems across Amazon Web Services (AWS) , Microsoft Azure, and Google Cloud Platform (GCP) for faster digital transformation introduces a whole host of challenges. Dynatrace news. Collecting data requires massive and ongoing configuration efforts.
It affects only those extensions that use native libraries called from Python code distributed with the extension. Symptoms : Metrics provided by affected extensions may stop working, such that no data is provided for affected metrics on dashboards, alerts, and custom device pages populated by the affected extension metrics.
By implementing service-level objectives, teams can avoid collecting and checking a huge amount of metrics for each service. According to Google’s SRE handbook , best practices, there are “ Four Golden Signals ” we can convert into four SLOs for services: reliability, latency, availability, and saturation.
Function as a service is a cloud computing model that runs code in small modular pieces, or microservices. Cloud providers such as Google, Amazon Web Services, and Microsoft also followed suit with frameworks such as Google Cloud Functions , AWS Lambda , and Microsoft Azure Functions. What is FaaS?
Organizations can now accelerate innovation and reduce the risk of failed software releases by incorporating on-demand synthetic monitoring as a metrics provider for automatic, continuous release-validation processes. This metric indicates how quickly software can be released to production. Dynatrace news.
Thats why the Time to First Byte (TTFB) metric is important: it measures how soon after navigation the browser starts receiving the HTML response. But actually, theres a lot more to optimizing this metric. What Components Make Up The Time To First Byte Metric? TTFB stands for Time to First Byte. But where does it measure from ?
Principal engineer at Google and co-founder of KubeCon, Hightower advocates simplicity and automation. If you’re going to have an SLO, you should have a story in mind of why you’re setting up all these alerts and collecting all these metrics. Infrastructure as code vs infrastructure as data. Dynatrace news.
In February 2021, Dynatrace announced full support for Google’s Core Web Vitals metrics , which will help site owners as they start optimizing Core Web Vitals performance for SEO. Dynatrace Business Insights views summarize top Core Web Vitals metrics and scores with 100% precision. Dynatrace news. 28-day lookbacks.
If you want to know more about keptn, I encourage you to check out www.keptn.sh , “What is keptn and how to get started” (blog), “Getting started with keptn” (YouTube) or my slides on Shipping Code like a keptn. Automated Metric Anomaly Detection. Alerting on high CPU is not special – but – I am really only running a small node.js
Additionally, PurePath provides distributed tracing with code-level detail at scale with contextual data. After American Family completed its initial conversion to Dynatrace, they needed to automate how their system ingested Amazon CloudWatch metrics. Step 1: Automate AWS metrics ingestion with Dynatrace. It only costs about $.01
At Dynatrace, we measure the DORA metrics from Google. These include: Deployment frequency: How often is code deployed? Lead time for changes: How long does it take to get committed code into production? The first DORA metric is rather easy; we simply look at the throughput of the main branch. Sneak-peek time!
How To Benchmark And Improve Web Vitals With Real User Metrics. How To Benchmark And Improve Web Vitals With Real User Metrics. Different products will have different benchmarks and two apps may perform differently against the same metrics, but still rank quite similarly to our subjective “good” and “bad” verdicts.
Although you can code the logic that governs communication directly into the microservices, a service mesh abstracts that logic into a parallel layer of infrastructure using a proxy called a sidecar, which runs alongside each service. A service mesh enables DevOps teams to manage their networking and security policies through code.
I was browsing Tim Kadlec’s website and I noticed he had added page load time metrics in the footer. Stoyan Stefanov also realized and wrote “This page loaded in X seconds” , a blog post describing the code used for this. First Paint and First Contentful Paint Page load time is a metric that tells us part of the story.
As a result, site reliability has emerged as a critical success metric for many organizations. The following three metrics are commonly used to measure success: Service-level agreements (SLAs). These metrics are the factors and service levels that must be achieved for each activity, function, and process to deliver on the SLA.
Several distributions of Kubernetes rely on containerd as their default container runtime, including the IBM Kubernetes Service (IKS) and Google Kubernetes Engine (GKE). This category hosts many single-purpose projects and solutions that focus either on metrics, traces, or logs.
Microservices are run using container-based orchestration platforms like Kubernetes and Docker or cloud-native function-as-a-service (FaaS) offerings like AWS Lambda, Azure Functions, and Google Cloud Functions, all of which help automate the process of managing microservices. To fully answer “What are microservices?”
We organize all of the trending information in your field so you don't have to. Join 5,000+ users and stay up to date on the latest articles your peers are reading.
You know about us, now we want to get to know you!
Let's personalize your content
Let's get even more personalized
We recognize your account from another site in our network, please click 'Send Email' below to continue with verifying your account and setting a password.


Let's personalize your content