This site uses cookies to improve your experience. To help us insure we adhere to various privacy regulations, please select your country/region of residence. If you do not select a country, we will assume you are from the United States. Select your Cookie Settings or view our Privacy Policy and Terms of Use.
Cookie Settings
Cookies and similar technologies are used on this website for proper function of the website, for tracking performance analytics and for marketing purposes. We and some of our third-party providers may use cookie data for various purposes. Please review the cookie settings below and choose your preference.
Used for the proper function of the website
Used for monitoring website traffic and interactions
Cookie Settings
Cookies and similar technologies are used on this website for proper function of the website, for tracking performance analytics and for marketing purposes. We and some of our third-party providers may use cookie data for various purposes. Please review the cookie settings below and choose your preference.
Strictly Necessary: Used for the proper function of the website
Performance/Analytics: Used for monitoring website traffic and interactions
Developers are key stakeholders in modern observability. In this blog post, we will see how Dynatrace harnesses the power of observability and analytics to tailor a new experience to easily extend to the left, allowing developers to solve issues faster, build more efficient software, and ultimately improve developer experience!
Developers need a way to quickly set up alerts for targeted pre-production exceptions without incurring steep costs or heavy overhead. This caused you to lose complete visibility of your containers logs, performance, and error data, and you could not tell if the system was down or not. Ready to try Simple Workflows?
After a successful 3rd beta in August 2024, the PostgreSQL development group released the GA version on September 26th. In this blog, I'll describe a couple of new performance features that you'll find in Postgres 17 as well as another important logical replication feature that I didn't cover in my earlier blog of this series.
Today, development teams suffer from a lack of automation for time-consuming tasks, the absence of standardization due to an overabundance of tool options, and insufficiently mature DevSecOps processes. This leads to frustrating bottlenecks for developers attempting to build and deliver software.
Every software developer has faced the frustration of debugging. Developers deserve a seamless way to troubleshoot effectively and gain quick insights into their code to identify issues regardless of when or where they arise. With a single click, developers can access the necessary and relevant data without adding new code.
This link allows us to open Live Debugger and dive into the code level of the AdService (example service) without requiring code changes or application redeployments. We use the automatically populated filter for AdService and its corresponding source code repository, then select Done to go to Live Debugger.
I work at Appsmith , an open-source low code platform for developers to build internal tools and workflows. At Appsmith, our developer users define business logic by writing any JS code in between {{ }} dynamic bindings almost anywhere in the app. They can use this while creating SQL queries, APIs, or triggering actions.
To tame this complexity and deliver differentiated digital experiences, IT, development, security, and business teams need automated workflows throughout these cloud ecosystems. But to be scalable, they also need low-code/no-code solutions that don’t require a lot of spin-up or engineering expertise.
Perform is our company’s event once a year in Las Vegas, where our customers and partners visit us to learn more about our product and industry. However, it was my first time at Perform, and although I knew I would learn a thing or two in the next week, I was unaware of how beneficial taking part in this event would be.
If you’re a web developer , you probably spend a fair amount of time working with Chrome DevTools. It’s one of the best tools out there for diagnosing and improving the performance of your web applications. But there’s an important piece of performance data that DevTools doesn’t yet expose by default: Long Animation Frames (LoAFs).
Code Quality defines that the code is good, which means code is of high quality, and code is bad, which means code is of low quality. Code can be considered good quality if it is clear, simple, well tested, bug-free, refactored, documented, and performant.
In the ever-evolving software paradigm, oftentimes multiple developers work on the shared code base collaboratively. Code management becomes challenging with the number of developers, the scope of change, the pace of delivery, etc on a shared code base.
For operations, development and security teams, the pressure to deliver better, more secure software faster has never been more critical for business value. At Dynatrace Perform 2022 in February, the theme was “Empowering the game changers.”. Dynatrace Delivers Software Intelligence as Code. Dynatrace news. Learn more!
In all seriousness, the shift-left mantra has shaken things up quite a bit in the tech industry, bringing a paradigm shift in how we approach software development. Today, engineers are spending an increasing amount of time developing and testing code in production-like environments.
By which I mean it can make developers produce more. The question is whether those developers are producing something good or not. The difference between an experienced developer and a junior is that an experienced developer knows: There’s more than one good solution to every problem. I want to be very clear here.
The IT world is rife with jargon — and “as code” is no exception. “As code” means simplifying complex and time-consuming tasks by automating some, or all, of their processes. Today, the composable nature of code enables skilled IT teams to create and customize automated solutions capable of improving efficiency.
Our goal is to speed up development and minimize rollbacks. We want developers to be able to work efficiently while taking ownership of their databases. To achieve this level of quality, they rely on a range of practices, including thorough testing, code reviews, automated CI/CD pipelines , and component monitoring.
Each must be evaluated by development teams, leading to wasted time and effort in identifying real vulnerabilities. All-new Dynatrace code-level vulnerability detection All-new Dynatrace code-level vulnerability detection evaluates all requests passing through your applications to identify vulnerabilities.
Application observability helps IT teams gain visibility in their highly distributed systems, but what is developer observability and why is it important? In a recent webinar , Dynatrace DevOps activist Andi Grabner and senior software engineer Yarden Laifenfeld explored developer observability. Observability is about answering.”
Whether you’re troubleshooting a specific issue or looking to improve overall system performance, Distributed tracing equips you with the tools you need to make informed decisions and maintain a high standard of application performance. To understand the benefits of the Distributed Tracing app, let’s take a look at a typical scenario.
We recently announced Dynatrace Live Debugger , which gives developers unprecedented access to real-time data and runtime behavior insights. This powerful tool can be leveraged across various environments, including production, to enhance development processes and ensure robust application performance.
Developers are increasingly responsible for ensuring the quality and security of code throughout the software lifecycle. This can disrupt the users of the running application, slow down the application’s performance, or even crash it altogether. Debugging in production often requires shutting down services.
The Dynatrace Culture Code originated from the need to connect our company culture’s strategic dots into a single source of truth that expresses it simply and clearly. Connecting the dots and embracing boldness While the Dynatrace Culture Code was only recently rolled out, most key elements already existed within Dynatrace.
As organizations look to expand DevOps maturity, improve operational efficiency, and increase developer velocity, they are embracing platform engineering as a key driver. The goal is to abstract away the underlying infrastructure’s complexities while providing a streamlined and standardized environment for development teams.
Effective application development requires speed and specificity. Applications must work as intended and make their way through development pipelines as quickly as possible. FaaS enables enterprises to deliver on the evolving expectations of fast and furious app development. But what is FaaS? What is FaaS?
There are tools that simply help you monitor the overall performance of an app while it's in use on a device. The data can be used by developers to improve the application based on what is relevant and important to their end-users.
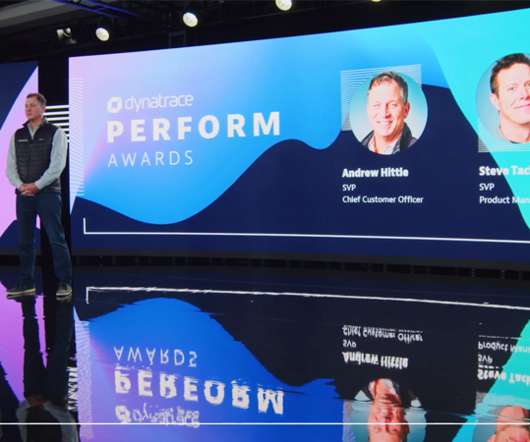
During Dynatrace Perform , we have the honor of hosting a customer awards ceremony to highlight the most inspiring success stories from our most innovative, transformative customers. DevOps : companies who shorten innovation cycles, automate their CI/CD pipelines, and improve code quality for production. Dynatrace news.
At the 2024 Dynatrace Perform conference in Las Vegas, Michael Winkler, senior principal product management at Dynatrace, ran a technical session exploring just some of the many ways in which Dynatrace helps to automate the processes around development, releases, and operation. Real-time detection for fast remediation.
Let's kick off the new year by celebrating someone who has not just had a huge impact on web performance over the past few years, but who has even more exciting stuff in the works for the future: Annie Sullivan! Annie and her team navigate this arduous task with true passion for web performance and for improving the user experience.
Dynatrace OTel Collector Understand your applications with ease Due to a lack of contextual insights and actionable intelligence, application teams often find themselves overwhelmed by data, unable to quickly identify the root causes of performance issues. This eliminates the need for swapping tools or manual log correlation.
These are just some of the topics being showcased at Perform 2023 in Las Vegas. Perform 2023 news At Perform 2023 in Las Vegas, the headliner theme is IT automation. For example, development teams can use automation to increase efficiency in the software development lifecycle.
Whether youre a developer, database administrator, or data analyst, a good GUI can make everyday tasks faster, clearer, and less error-prone. Built and maintained by Oracle, it provides an all-in-one solution for database modeling, query execution, user administration, and performance monitoring. Thats where MySQL GUIs come in.
Infrastructure as code is a way to automate infrastructure provisioning and management. In this blog, I explore how Dynatrace has made cloud automation attainable—and repeatable—at scale by embracing the principles of infrastructure as code. Infrastructure-as-code. But how does it work in practice? Transparency and scalability.
Every software development team grappling with Generative AI (GenAI) and LLM-based applications knows the challenge: how to observe, monitor, and secure production-level workloads at scale. Developers deserve a frictionless troubleshooting experience and fast access to real-time datano more guesswork or costly redeployments.
iOS development has long been associated with Apple's ecosystem and Xcode, which is only available for macOS. However, with the growing popularity of iOS apps, developers using Linux have sought ways to perform iOS development on their preferred operating system. Some of the popular cross-platform tools are:
Once we press the merge button, that code is no longer our responsibility. If it performs sub-optimally or has a bug, it is now the problem of the DevOps team, the SRE, etc. If my code uses up too much RAM, they will increase RAM. When the code runs slower, it will increase CPU.
Mobile applications (apps) are an increasingly important channel for reaching customers, but the distributed nature of mobile app platforms and delivery networks can cause performance problems that leave users frustrated, or worse, turning to competitors. What is mobile app performance? Issue remediation.
Dynatrace CEO Rick McConnell at Perform 2022 in Las Vegas. Organizations are accelerating movement to the cloud, resulting in complex combinations of hybrid, multicloud [architecture],” said Rick McConnell, Dynatrace chief executive officer at the annual Perform conference in Las Vegas this week. Dynatrace news.
Every year at our annual user conference, Dynatrace Perform , we recognize the most inspiring success stories from our most innovative, transformative customers and partners. DevOps: companies who shorten innovation cycles, automate their CI/CD pipelines , and improve code quality for production. These are individual awards.
Through containers developed within VA Platform One (VAPO), the development team at the U.S. Department of Veterans Affairs (VA) is packaging application code along with its libraries and dependencies within an executable software unit. VA Platform One (VAPO) is a comprehensive application development and delivery platform.
Once you achieve initial observability, you can develop actionable alerts, create useful dashboards, and evaluate AIOps solutions. This visibility also ensures there are no performance issues with customer-facing transactions or internal applications critical to your business. Microsoft believes observability enables monitoring.
Challenge: Dont understand the cascading effects of their setup on these perceived black box personalization systems - Personalization System Engineers Role: Develop and operate the personalization systems. Challenge: End up spending unplanned cycles on title launch and personalization investigations.
Enabling keyboard shortcuts and possessing visual appeal and transparency to minimize strain on wrists and eyesight to prevent Carpal Tunnel Syndrome and visual impairment from developing in users. To conclude, GUIs are a vital addition to ease the lives of database users and developers. Pricing: Free: All features included.
We organize all of the trending information in your field so you don't have to. Join 5,000+ users and stay up to date on the latest articles your peers are reading.
You know about us, now we want to get to know you!
Let's personalize your content
Let's get even more personalized
We recognize your account from another site in our network, please click 'Send Email' below to continue with verifying your account and setting a password.


Let's personalize your content