This site uses cookies to improve your experience. To help us insure we adhere to various privacy regulations, please select your country/region of residence. If you do not select a country, we will assume you are from the United States. Select your Cookie Settings or view our Privacy Policy and Terms of Use.
Cookie Settings
Cookies and similar technologies are used on this website for proper function of the website, for tracking performance analytics and for marketing purposes. We and some of our third-party providers may use cookie data for various purposes. Please review the cookie settings below and choose your preference.
Used for the proper function of the website
Used for monitoring website traffic and interactions
Cookie Settings
Cookies and similar technologies are used on this website for proper function of the website, for tracking performance analytics and for marketing purposes. We and some of our third-party providers may use cookie data for various purposes. Please review the cookie settings below and choose your preference.
Strictly Necessary: Used for the proper function of the website
Performance/Analytics: Used for monitoring website traffic and interactions
Cloud-native technologies and microservice architectures have shifted technical complexity from the source code of services to the interconnections between services. Observability for heterogeneous cloud-native technologies is key. Heterogeneous cloud-native microservice architectures can lead to visibility gaps in distributed traces.
Although these COBOL applications operate with consistent performance, companies and governments are forced to transform them to new platforms and rewrite them in modern programming languages (like Java) for several reasons. Thus, implementing applications in Java can result in considerable financial savings.
Cloud-native technologies, including Kubernetes and OpenShift, help organizations accelerate innovation. Open source has also become a fundamental building block of the entire cloud-native stack. Why cloud-native applications, Kubernetes, and open source require a radically different approach to application security.
Most performance engineers have spent years submitting RFPs, developing scripts, executions, analysis, monitoring and tuning, and researching their specific projects/product domains and have gained a very high level of expertise in it. and must have extensive experience in specialized skills.
Cloud Run brings serverless to containers. You can run containers on Cloud Run for Anthos for consistency between on-prem and cloud environments, or in fully managed Cloud Run environments. Run custom-built images as containers at scale with Google Cloud Run. What’s your experience with Cloud Run?
In this latest trends report, we analyze the most popular cloud providers for PostgreSQL, VACUUM strategies, query management strategies, and on-premises vs. public cloud use being leveraged by enterprise organizations. Most Popular Cloud Providers for PostgreSQL Hosting. of PostgreSQL cloud use compared to 55.0%
Optimizing RabbitMQ requires clustering, queue management, and resource tuning to maintain stability and efficiency. Apache Kafka primarily uses JAAS (Java Authentication and Authorization Service) for authentication. Integration Requirements: How well does the system integrate with existing tools, frameworks, and cloud platforms?
All the modern programming languages such as Golang, Node.js, Java,NET, Python, etc. Increase cloud hosting cost: It increases your cloud hosting cost. In an effort to reduce cloud hosting costs, recently, Uber tuned their garbage collection to reduce CPU utilization.
We’ve worked closely with our partner AWS to deliver a complete, end-to-end picture of your cloud environment that includes monitoring support for all AWS services. Full integration with existing Dynatrace capabilities for AWS Lambda (for example, metric ingestion via AWS Cloud Watch). So please stay tuned! Dynatrace news.
Compare ease of use across compatibility, extensions, tuning, operating systems, languages and support providers. Cloud Deployments. Can be deployed on any cloud provider, with a variety of PostgreSQL hosting solutions available. Compare PostgreSQL vs. Oracle functionality across available tools, capabilities and services.
Stefano started his presentation by showing how much cost and performance optimization is possible when knowing how to properly configure your application runtimes, databases, or cloud environments: Correct configuration of JVM parameters can save up to 75% resource utilization while delivering same or better performance!
At Dynatrace, where we provide a software intelligence platform for hybrid environments (from infrastructure to cloud) we see a growing need to measure how mainframe architecture and the services running on it contribute to the overall performance and availability of applications. Full-stack and cloud-infrastructure monitoring modes.
cloud service providers are now starting to add OpenTelemetry instrumentation as an out-of-the-box feature. Gain full observability in heterogeneous cloud-native environments and reduce resolution times. Stay tuned for the general availability of trace ingest. TL;DR summary. Detailed use case. What’s next.
Our first version is available to customers in the Intel Tiber AI Cloud as a preview for the Intel Data Center GPU Max Series (previously called Ponte Vecchio). I know of companies where flame graphs are a daily tool that developers use to understand and tune their code, reducing compute costs. Why is AI profiling hard?
With Dynatrace Infrastructure Monitoring you get a complete solution for the monitoring of cloud platforms and virtual infrastructure, along with log monitoring and AIOps. Monitor any infrastructure component and backing service that’s written in Java. So please stay tuned for more Infrastructure 2.0 announcements.
At Dynatrace, where we provide a software intelligence platform for hybrid environments (from infrastructure to cloud) we see a growing need to measure how mainframe architecture and the services running on it contribute to the overall performance and availability of applications. Full-stack and cloud-infrastructure monitoring modes.
Today’s highly dynamic, heterogeneous, and complex software systems require organizations to establish observability for all provided cloud-native services. Our new OpenTelemetry custom metric exporters provide the broadest language support on the market, covering Go ,NET , Java , JavaScript/Node.js , and Python. Dynatrace news.
Other distributions like Debian and Fedora are available as well, in addition to other software like VMware, NGINX, Docker, and, of course, Java. We understand the dependencies between the mainframe, data center, and cloud, including all application components and even end-user experience. Stay tuned for more details.
Cloud-native technologies, including Kubernetes and OpenShift, help organizations accelerate innovation and drive agility. We will further enhance the detection and blocking capability to cover additional attack types, so stay tuned for updates! Real-time attack detection and blocking for Java will be available in the next 120 days.
Though the majority of our services run on Linux Amazon Machine Images (AMIs), there are still many services critical to the Netflix Playback Experience running on Windows Elastic Compute Cloud (EC2) instances at scale. Our engineers no longer have to manually update Windows, Java, Tomcat, IIS, and other services.
I worked on providing code-level insights for Java and.NET services and applications before shifting gears and joining the OpenTelemetry community back in May 2019. From natural language processing, to collaboration software, plugins for Jira cloud, CloudFormation providers, and now the OpenTelemetry project. years ago.
And while those enterprises are moving applications to modern cloud stacks for agility and competitive advantage, these applications often still depend on critical transactions and ‘crown jewels’ customer data residing on IBM Z mainframes. Dynatrace news. OneAgent has come to master z/OS and it’s GA! CICS sockets). Who’s calling?
Our tactical approach was to use Netflix-specific libraries for collecting traces from Java-based streaming services until open source tracer libraries matured. We chose Open-Zipkin because it had better integrations with our Spring Boot based Java runtime environment.
NET , Java , JavaScript/Node.js , and Python. Keptn is an open source CNCF project providing an event-based control plane for continuous delivery and automated operations for cloud-native applications. Stay tuned. So we’ve decided to pre-instrument keptn to collect metrics provided by its statistics service.
A brief history of IPC at Netflix Netflix was early to the cloud, particularly for large-scale companies: we began the migration in 2008, and by 2010, Netflix streaming was fully run on AWS. Today we have a wealth of tools, both OSS and commercial, all designed for cloud-native environments.
It is available for the major OS and cloud platforms (for example, Windows, Linux, Solaris, AWS, Azure, and more) and only requires the deployment of a single service to monitor its environment. Garbage collection count Garbage collection is JVM related and indicates how often the Java GC ran.
Improve cloud platform management with deeper insights into platform metrics. It accepted requests from a Java-based load generator on port 8888 and forwarded the requests to the default port, 8086 , of a locally running InfluxDB instance that was installed via the apt-get package manager. So stay tuned!
The Amazon ML console and API provide data and model visualization tools, as well as wizards to guide you through the process of creating machine learning models, measuring their quality and fine-tuning the predictions to match your application requirements. More details on the AWS Blog.
For some context, over the past 15 years Ive been operating Python Tutor ( [link] ), a free online tool that tens of millions of people around the world have used to write, run, and visually debug their code (first in Python and now also in Java, C, C++, and JavaScript). A False Start by Locally Hosting an LLM Now onto the backend.
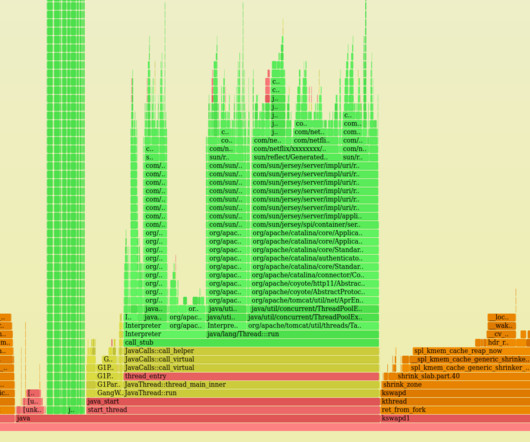
Monitoring I started with the cloud-wide monitoring tool, [Atlas], to check high-level CPU metrics. I was surprised to find a whopping 38% of CPU time was in sys, which is highly unusual for cloud workloads at my employer. Just for illustration, this shows the Vector UI and a typical cloud flame graph.
There's no Java stack—there should be a tower of green Java methods—instead there's only a single green frame or two. This is how Java flame graphs looked at the time. Later that year I prototyped the c2 frame pointer fix that became -XX:+PreserveFramePointer, which fixes Java stacks in these profiles.
No more hassles of benchmarking and tuning algorithms or building and maintaining infrastructure for vector search. Bridgecrew is the cloud security platform for developers. Client libraries are available for Node, Ruby, Python, PHP, Go, Java and.NET. Try the API now in this 5 minute interactive tutorial.
No more hassles of benchmarking and tuning algorithms or building and maintaining infrastructure for vector search. Bridgecrew is the cloud security platform for developers. Client libraries are available for Node, Ruby, Python, PHP, Go, Java and.NET. Try the API now in this 5 minute interactive tutorial.
No more hassles of benchmarking and tuning algorithms or building and maintaining infrastructure for vector search. Bridgecrew is the cloud security platform for developers. Client libraries are available for Node, Ruby, Python, PHP, Go, Java and.NET. Try the API now in this 5 minute interactive tutorial.
No more hassles of benchmarking and tuning algorithms or building and maintaining infrastructure for vector search. Bridgecrew is the cloud security platform for developers. Client libraries are available for Node, Ruby, Python, PHP, Go, Java and.NET. Try the API now in this 5 minute interactive tutorial.
The documentation mentions that the supported languages to profile are Go, Java (any JVM-based language), Python, Ruby, and NodeJS. Manual flame graphs collection Although the tool is excellent and automatically provides flame graphs, we don’t have much control over tuning the selected profiler.
One which: interleaves log with dump events so that both can make progress allows to trigger dumps at any time does not use table locks uses commonly available database features DBLog Framework DBLog is a Java-based framework, able to capture changes in real-time and to take dumps. Proceedings of the Third ACM Symposium on Cloud Computing.
One which: interleaves log with dump events so that both can make progress allows to trigger dumps at any time does not use table locks uses standardized database features DBLog Framework DBLog is a Java-based framework, able to capture changes in real-time and to take dumps. Proceedings of the Third ACM Symposium on Cloud Computing.
The Java Advent 2021 is here! The project started in 2012 with the idea of providing technical content during the Christmas Advent period, so keep looking for nice things under the Java Christmas tree! ??. Tune in each day for an article that explores the wide range of topics in system administration. SysAdvent on Twitter.
Cloud computing? But in its early form of a Hadoop-based ML library, Mahout still required data scientists to write in Java. And just as we started to complain that the crypto miners were snapping up all of the affordable GPU cards, cloud providers stepped up to offer access on-demand. So we can ride that wave of publicity.)
We're on the EC2 cloud, which has great scalability, and our own cloud architecture of microservices is also designed for scalability. Getting frame pointer support in Java was another project I did a while ago. Java core dump analysis for a crashing JVM. - That'd make a great story, but it didn't happen.
AWS Cloud 9 AWS Cloud 9 is ideal for developing PHP applications completely in the cloud. Eclipse PDT Though originally intended for Java coding, Eclipse can be extended to support PHP with the PDT plugin. PHPUnit PHPUnit is just like JUnit except that it’s for PHP testing instead of Java testing.
Monitoring I started with the cloud-wide monitoring tool, Atlas , to check high-level CPU metrics. I was surprised to find a whopping 38% of CPU time was in sys, which is highly unusual for cloud workloads at Netflix. The default size is 128 Kbytes, and people shouldn't be tuning below 8 Kbytes.
There's no Java stack—there should be a tower of green Java methods—instead there's only a single green frame or two. This is how Java flame graphs looked at the time. Later that year I prototyped the c2 frame pointer fix that became -XX:+PreserveFramePointer, which fixes Java stacks in these profiles.
We organize all of the trending information in your field so you don't have to. Join 5,000+ users and stay up to date on the latest articles your peers are reading.
You know about us, now we want to get to know you!
Let's personalize your content
Let's get even more personalized
We recognize your account from another site in our network, please click 'Send Email' below to continue with verifying your account and setting a password.


Let's personalize your content