This site uses cookies to improve your experience. To help us insure we adhere to various privacy regulations, please select your country/region of residence. If you do not select a country, we will assume you are from the United States. Select your Cookie Settings or view our Privacy Policy and Terms of Use.
Cookie Settings
Cookies and similar technologies are used on this website for proper function of the website, for tracking performance analytics and for marketing purposes. We and some of our third-party providers may use cookie data for various purposes. Please review the cookie settings below and choose your preference.
Used for the proper function of the website
Used for monitoring website traffic and interactions
Cookie Settings
Cookies and similar technologies are used on this website for proper function of the website, for tracking performance analytics and for marketing purposes. We and some of our third-party providers may use cookie data for various purposes. Please review the cookie settings below and choose your preference.
Strictly Necessary: Used for the proper function of the website
Performance/Analytics: Used for monitoring website traffic and interactions
The rapid evolution of cloud technology continues to shape how businesses operate and compete. This year’s AWS re:Invent will showcase a suite of new AWS and Dynatrace integrations designed to enhance cloud performance, security, and automation.
As organizations adopt more cloud-native technologies, the risk—and consequences—of cyberattacks are also increasing. The Dynatrace platform has been recognized for seamlessly integrating with the Microsoft Sentinel cloud-native security information and event management ( SIEM ) solution.
DevOps and security teams managing today’s multicloud architectures and cloud-native applications are facing an avalanche of data. On average, organizations use 10 different tools to monitor applications, infrastructure, and user experiences across these environments.
If you use Windows, you will want to monitor Windows Events. A recent contribution of a distribution of the OpenTelemetry (OTel) Collector makes it much easier to monitor Windows Events with OpenTel. We will be shipping Windows Event logs to a popular backend: Google Cloud Ops. What Signals Matter?
The Dynatrace platform automatically captures and maps metrics, logs, traces, events, user experience data, and security signals into a single datastore, performing contextual analytics through a “power of three AI”—combining causal, predictive, and generative AI. What’s behind it all?
To this end, we developed a Rapid Event Notification System (RENO) to support use cases that require server initiated communication with devices in a scalable and extensible manner. In this blog post, we will give an overview of the Rapid Event Notification System at Netflix and share some of the learnings we gained along the way.
FinOps , short for Financial Operations, is a methodology combining finance, technology, and business teams to optimize cloud spending and maximize value in cloud environments. Costs and their origin are transparent, and teams are fully accountable for the efficient usage of cloud resources.
The annual Google Cloud Next conference explores the latest innovations for cloud technology and Google Cloud. This year, Google’s event will take place from April 9 to 11 in Las Vegas. As organizations continue to expand within cloud-native environments using Google Cloud, ensuring scalability becomes a top priority.
AWS Security Hub findings AWS Security Hub provides a great way of aggregating security findings, especially those related to cloud infrastructure. It can also be challenging to construct a full view of one’s security exposures when analyzing security findings across various environments and cloud infrastructures.
Dynatrace enables our customers to monitor and optimize their cloud infrastructure and applications through the Dynatrace Software Intelligence Platform. We want to share how Dynatrace helped us identify and fix memory leaks in one of the most central and critical components within Keptn: our event broker. Dynatrace news.
For example, if you’re monitoring network traffic and the average over the past 7 days is 500 Mbps, the threshold will adapt to this baseline. Using a seasonal baseline, you can monitor sales performance based on the past fourteen days. For instance, in a web shop, sales might vary by day of the week.
In many cases, events are generated as these workloads go through different phases of their life cycles. For instance, events appear when the scheduler performs actions to bring workloads back to a desired state. For better or worse, every Kubernetes user learns about the CrashLoopBackOff and ImagePullBackOff events.
Recently, we’ve expanded our digital experience monitoring to cover the entire customer journey, from conversion to fulfillment. Consolidate real-user monitoring, synthetic monitoring, session replay, observability, and business process analytics tools into a unified platform.
And to tame cloud complexity at scale, organizations need comprehensive observability powered by AI, automation, and application security. . We call that approach Cloud done right. . So, why is Cloud done right so critical to every cloud migration? See what Cloud done right means for your business and teams: .
Digital experience monitoring (DEM) is crucial for organizations to meet this demand and succeed in today’s competitive digital economy. DEM solutions monitor and analyze the quality of digital experiences for users across digital channels. The time taken to complete the page load.
Synthetic monitoring can help to confirm your applications are performing as intended and, in the event they’re not, help you quickly figure out what’s going on. Here’s a look at what synthetic monitoring is, how it’s different from real-user monitoring, and why it matters to your business.
Kubernetes has taken over the container management world and beyond , to become what some say the operating system or the new Linux of the cloud. Eventually, like Linux, Kubernetes will become a mainstream commodity , taken for granted and fade into the background , an intricate piece of the fabric of the cloud. .
However, with these benefits come complexities in terms of cloud management, Kubernetes observability, and automation, making it imperative for enterprises to address these intricacies to enhance reliability, performance, and resource usage. So many tools can result in data inconsistencies.
In cloud-native environments, there can also be dozens of additional services and functions all generating data from user-driven events. This is critical to ensure high performance, security, and a positive user experience for cloud-native applications and services. Comparing log monitoring, log analytics, and log management.
Log monitoring, log analysis, and log analytics are more important than ever as organizations adopt more cloud-native technologies, containers, and microservices-based architectures. Driving this growth is the increasing adoption of hyperscale cloud providers (AWS, Azure, and GCP) and containerized microservices running on Kubernetes.
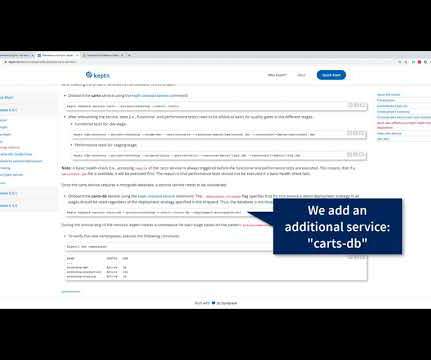
Self-Service Progressive Delivery of Microservices, Automated SLI/SLO based Quality Gates, Continuous Feedback through ChatOps and Automatic Remediation of Production Issues are some of the capabilities you expect from a modern cloud-native software delivery platform. The recent improvements released in Keptn 0.6,
But are observability platforms—born from the collision between the demands of cloud computing and the limitations of APM and infrastructure monitoring—the best solution for managing business analytics? To close these critical gaps, Dynatrace has defined a new class of events called business events.
Rising cloud complexity has made securing cloud-native and multicloud applications significantly more difficult. With the pace of digital transformation continuing to accelerate, organizations are realizing the growing imperative to have a robust application security monitoring process in place.
Azure Automation provides an extremely powerful set of tools for automating operations within enterprises on hybrid cloud. You can now simplify cloud operations with automated observability into the performance of your Azure cloud platform services in context with the performance of your applications. What is Azure Automation?
As more organizations invest in a multicloud strategy, improving cloud operations and observability for increased resilience becomes critical to keep up with the accelerating pace of digital transformation. American Family turned to Dynatrace to help them monitor complex environments without the hassle. ski explains.
By: Rajiv Shringi , Oleksii Tkachuk , Kartik Sathyanarayanan Introduction In our previous blog post, we introduced Netflix’s TimeSeries Abstraction , a distributed service designed to store and query large volumes of temporal event data with low millisecond latencies. Today, we’re excited to present the Distributed Counter Abstraction.
Leveraging cloud-native technologies like Kubernetes or Red Hat OpenShift in multicloud ecosystems across Amazon Web Services (AWS) , Microsoft Azure, and Google Cloud Platform (GCP) for faster digital transformation introduces a whole host of challenges. Dynatrace news. Logs provide information you can’t find anywhere else.
Business events are a special class of events, new to Business Analytics; together with Grail, our data lakehouse, they provide the precision and advanced analytics capabilities required by your most important business use cases. What are business events? This diagram shows a few examples of business events.
In recent years, function-as-a-service (FaaS) platforms such as Google Cloud Functions (GCF) have gained popularity as an easy way to run code in a highly available, fault-tolerant serverless environment. What is Google Cloud Functions? Google Cloud Functions is a serverless compute service for creating and launching microservices.
As cloud environments become increasingly complex, legacy solutions can’t keep up with modern demands. As a result, companies run into the cloud complexity wall – also known as the cloud observability wall – as they struggle to manage modern applications and gain multicloud observability with outdated tools.
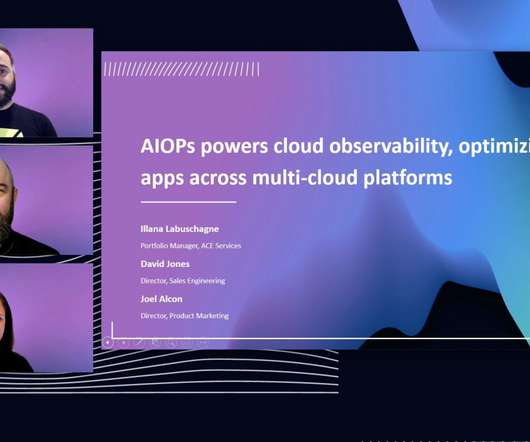
AIOps offers an alternative to traditional infrastructure monitoring and management with end-to-end visibility and observability into IT stacks. But increasing complexity and lacking visibility creates a problem: Enterprises invest more resources into monitoring and don’t get the data and answers they need. AIOps can help.
Infrastructure monitoring is the process of collecting critical data about your IT environment, including information about availability, performance and resource efficiency. Many organizations respond by adding a proliferation of infrastructure monitoring tools, which in many cases, just adds to the noise. Dynatrace news.
Real-time streaming needs real-time analytics As enterprises move their workloads to cloud service providers like Amazon Web Services, the complexity of observing their workloads increases. As cloud complexity grows, it brings more volume, velocity, and variety of log data. Managing this change is difficult.
Cloud-based solutions typically aren’t a viable option or enterprises that have strict security or privacy policies that require their data to be maintained on-premise. To give you a helping hand in such scenarios, we decided to facilitate Managed cluster deployments for major cloud platforms. Dynatrace news. Prerequisites.
For cloud operations teams, network performance monitoring is central in ensuring application and infrastructure performance. Network traffic growth is the main reason for increasing spending, largely because of the adoption of hybrid and multi-cloud architectures.
How To Design For High-Traffic Events And Prevent Your Website From Crashing How To Design For High-Traffic Events And Prevent Your Website From Crashing Saad Khan 2025-01-07T14:00:00+00:00 2025-01-07T22:04:48+00:00 This article is sponsored by Cloudways Product launches and sales typically attract large volumes of traffic.
As organizations expand their cloud footprints, they are combining public, private, and on-premises infrastructures. But modern cloud infrastructure is large, complex, and dynamic — and over time, this cloud complexity can impede innovation. VA’s journey into the cloud.
This trend is prompting advances in both observability and monitoring. But exactly what are the differences between observability vs. monitoring? Monitoring and observability provide a two-pronged approach. To get a better understanding of observability vs monitoring, we’ll explore the differences between the two.
Cloud environments—including multicloud, hybrid, and cloud-native ecosystems—offer unmatched agility, scalability, and cost-effectiveness, though they also present new challenges and complexities that are impossible to manage manually. Example workflow for event-driven vulnerability reporting and escalation.
Cloud-native observability for Google’s fully managed GKE Autopilot clusters demands new methods of gathering metrics, traces, and logs for workloads, pods, and containers to enable better accessibility for operations teams. First, we create a small Kubernetes cluster in the Google Cloud Console. and GKE Autopilot 126.
For IT teams seeking agility, cost savings, and a faster on-ramp to innovation, a cloud migration strategy is critical. Cloud migration enables IT teams to enlist public cloud infrastructure so an organization can innovate without getting bogged down in managing all aspects of IT infrastructure as it scales. Dynatrace news.
Cloud observability is fast becoming an imperative as more organizations adopt multicloud IT strategies. To adapt, many are turning to AIOps and other automation technologies to solve the complex issues that accompany cloud-native architecture. Multicloud complexity obscures cloud observability. Dynatrace news.
These resources generate vast amounts of data in various locations, including containers, which can be virtual and ephemeral, thus more difficult to monitor. These challenges make AWS observability a key practice for building and monitoringcloud-native applications. AWS monitoring best practices. And why it matters.
Cloud observability can bring business value, said Rick McConnell, CEO at Dynatrace. Organizations have clearly experienced growth, agility, and innovation as they move to cloud computing architecture. But without effective cloud observability, they continue to experience challenges in their cloud environments.
We organize all of the trending information in your field so you don't have to. Join 5,000+ users and stay up to date on the latest articles your peers are reading.
You know about us, now we want to get to know you!
Let's personalize your content
Let's get even more personalized
We recognize your account from another site in our network, please click 'Send Email' below to continue with verifying your account and setting a password.


Let's personalize your content