This site uses cookies to improve your experience. To help us insure we adhere to various privacy regulations, please select your country/region of residence. If you do not select a country, we will assume you are from the United States. Select your Cookie Settings or view our Privacy Policy and Terms of Use.
Cookie Settings
Cookies and similar technologies are used on this website for proper function of the website, for tracking performance analytics and for marketing purposes. We and some of our third-party providers may use cookie data for various purposes. Please review the cookie settings below and choose your preference.
Used for the proper function of the website
Used for monitoring website traffic and interactions
Cookie Settings
Cookies and similar technologies are used on this website for proper function of the website, for tracking performance analytics and for marketing purposes. We and some of our third-party providers may use cookie data for various purposes. Please review the cookie settings below and choose your preference.
Strictly Necessary: Used for the proper function of the website
Performance/Analytics: Used for monitoring website traffic and interactions
This blog post will walk you through the process of blocking your site's indexing on Kubernetes Ingress using robots.txt file, preventing search engine bots from crawling and indexing your content.
A Data Movement and Processing Platform @ Netflix By Bo Lei , Guilherme Pires , James Shao , Kasturi Chatterjee , Sujay Jain , Vlad Sydorenko Background Realtime processing technologies (A.K.A stream processing) is one of the key factors that enable Netflix to maintain its leading position in the competition of entertaining our users.
Dynatrace transforms this unstructured data into a strategic advantage, processing it automatically—no manual tagging required. With over 2.5 quintillion bytes of data generated daily, managing this influx has far surpassed human capacity. This ability to innovate faster has given TD Bank a competitive edge in a complex market.
This blog post will explore these exciting developments and what they mean for organizations. This integration simplifies the process of embedding Dynatrace full-stack observability directly into custom Amazon Machine Images (AMIs). Third-party trademarks mentioned in this blog are the property of their respective owners.
This introductory blog focuses on an overview of our journey. Future blogs will provide deeper dives into each service, sharing insights and lessons learned from this process. Future blogs will provide deeper dives into each service, sharing insights and lessons learned from this process.
Consolidate real-user monitoring, synthetic monitoring, session replay, observability, and business process analytics tools into a unified platform. Real-time customer experience remediation identifies and informs the organization about any issues and prevents them in the experience process sooner. See the overview on the homepage.
This is crucial because middleware often serves as the bridge between client applications and backend databases, handling a high volume of requests and data processing tasks. This blog post explores various techniques to optimize database performance , specifically in the context of middleware applications.
By Abhinaya Shetty , Bharath Mummadisetty In the inaugural blog post of this series, we introduced you to the state of our pipelines before Psyberg and the challenges with incremental processing that led us to create the Psyberg framework within Netflix’s Membership and Finance data engineering team.
Among the spectrum of methodologies available for this task, batch processing is often considered an old guard, especially with the advent of real-time and event-based processing technologies. However, it would be a mistake to dismiss batch processing as an antiquated approach.
In this blog post, we will see how Dynatrace harnesses the power of observability and analytics to tailor a new experience to easily extend to the left, allowing developers to solve issues faster, build more efficient software, and ultimately improve developer experience!
By: Rajiv Shringi , Oleksii Tkachuk , Kartik Sathyanarayanan Introduction In our previous blog post, we introduced Netflix’s TimeSeries Abstraction , a distributed service designed to store and query large volumes of temporal event data with low millisecond latencies. This process can also be used to track the provenance of increments.
Dynatrace OpenPipeline is a new stream processing technology that ingests and contextualizes data from any source. Business process monitoring and optimization. All of these steps are critical components of the process, likely to be implemented using different systems. Business event ingestion and analysis with log files.
Advanced processing on your observability platform unlocks the full value of log data. Dynatrace now includes powerful log-processing capabilities for all types of log data. Log data is processed on ingest, whether coming from a fleet of OneAgents deployed across your enterprise hosts or generic API ingest from cloud services.
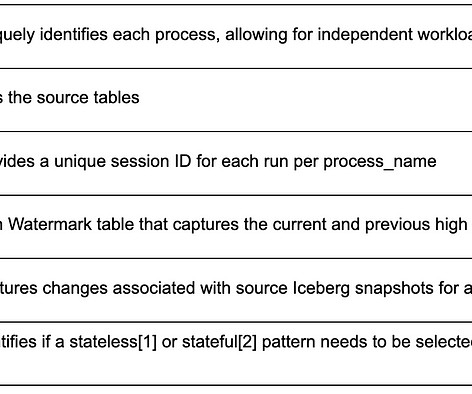
by Jun He , Yingyi Zhang , and Pawan Dixit Incremental processing is an approach to process new or changed data in workflows. The key advantage is that it only incrementally processes data that are newly added or updated to a dataset, instead of re-processing the complete dataset.
This blog post dissects the vulnerability, explains how Struts processes file uploads, details the exploit mechanics, and outlines mitigation strategies. This allows developers to easily access and process the file without handling the upload mechanics directly. Complete mitigation is only guaranteed in Struts version 7.0.0
Ensuring smooth operations is no small feat, whether you’re in charge of application performance, IT infrastructure, or business processes. Have a look at our recent Davis CoPilot blog post for more information and practical use cases. Your trained eye can interpret them at a glance, a skill that sets you apart.
The newly introduced step-by-step guidance streamlines the process, while quick data flow validation accelerates the onboarding experience even for power users. Step-by-step setup The log ingestion wizard guides you through the prerequisites and provides ready-to-use command examples to start the installation process. Figure 5.
In this blog, we will focus on histograms and why to use them. This self-monitoring aspect is crucial for maintaining the health and efficiency of the Collector itself, ensuring that it can handle the demands of large-scale data collection and processing without degradation. What are histograms, and why use them?
A production bug is the worst; besides impacting customer experience, you need special access privileges, making the process far more time-consuming. It also makes the process risky as production servers might be more exposed, leading to the need for real-time production data. This cumbersome process should not be the norm.
In a recent blog post, we announced and demonstrated how the new Distributed Tracing app provides effortless trace insights. Conclusion In this blog post, we explored how the Distributed Tracing app can be harnessed to visualize data ingested from the OpenTelemetry collector to get an overview of application health.
Smartscape topology visualizes the relationships between applications, services, processes, hosts, and data centers, highlighting problems and vulnerabilities. Workflows assembles a series of actions to build processes in graphical representations.
If you’re an existing customer and want to upgrade to the attribute-based access control system, check out our new guide , which will walk you through the process. This blog post is part of our series on Tailored access management.
For more details, see our recent blog post explaining how new Dynatrace capabilities help modern app teams analyze OpenTelemetry traces and log data at scale. Automatic data capture and display: More data, including span attributes, is available for out-of-the-box analysis, with no additional configuration necessary.
In our latest research, we analyzed social media, blogs, and other online sources to identify early indicators of such vulnerabilities. To detect any possible effects of the vulnerability before it was published, we cross-referenced data from multiple sources, scraping Jira, Mastodon, GitHub, and various security blogs.
It requires a state-of-the-art system that can track and process these impressions while maintaining a detailed history of each profiles exposure. In this multi-part blog series, we take you behind the scenes of our system that processes billions of impressions daily.
However, due to the fact that they boil down selected indicators to single values and track error budget levels, they also offer a suitable way to monitor optimization processes while aligning on single values to meet overall goals. By recognizing the insights provided, you can optimize processes and improve overall efficiency.
Integration with existing systems and processes : Integration with existing IT infrastructure, observability solutions, and workflows often requires significant investment and customization. Youll be able to read more about our approach to cloud cost optimization in an upcoming blog post.
In this blog post, we look at these enhancements, exploring methods for monitoring your Kubernetes environment and showcasing how modern dashboards can transform your data. Kickstarting the dashboard creation process is, however, just one advantage of ready-made dashboards.
Part 3: System Strategies and Architecture By: VarunKhaitan With special thanks to my stunning colleagues: Mallika Rao , Esmir Mesic , HugoMarques This blog post is a continuation of Part 2 , where we cleared the ambiguity around title launch observability at Netflix. The request schema for the observability endpoint.
However, due to the absence of a control group in these countries, we adopt a synthetic control framework ( blog post ) to estimate the counterfactual scenario. Each format has a different production process and different patterns of cash spend, called our Content Forecast. As plans change, the cash forecast will change.
In my last blog I covered how our Engineering Productivity (EP) and Infrastructure & Services (IAS) Teams are ensuring that our DevOps tool chain is running as expected, even while workloads have shifted as our global engineering teams are now working from home. Dynatrace news.
This shortens root cause analysis dramatically, as explained in our recent blog post Full Kubernetes logging in context from Fluent Bit to Dynatrace. This is explained in detail in our blog post, Unlock log analytics: Seamless insights without writing queries.
RabbitMQ is designed for flexible routing and message reliability, while Kafka handles high-throughput event streaming and real-time data processing. RabbitMQ follows a message broker model with advanced routing, while Kafkas event streaming architecture uses partitioned logs for distributed processing. What is Apache Kafka?
It’s a go-to database for many projects dealing with Online Transaction Processing systems. In this blog post, we’ll see other scenarios where PostgreSQL shines and will explain how to use it in these cases. In this blog post, we’ll see other scenarios where PostgreSQL shines and will explain how to use it in these cases.
Grail, the Dynatrace causational data lakehouse with a massively parallel processing analytics engine, unites observability, security, and business data from multicloud and cloud-native environments while retaining the data’s context to deliver precise answers in real time. What is a data lakehouse?
In the first blog post of this series , we explored how the Dynatrace ® observability and security platform boosts the reliability of Site Reliability Engineers (SRE) CI/CD pipelines and enhances their ability to focus on innovation. In this blog post, we’ll focus on the first stage of the pipeline, the Build stage.
As batch jobs run without user interactions, failure or delays in processing them can result in disruptions to critical operations, missed deadlines, and an accumulation of unprocessed tasks, significantly impacting overall system efficiency and business outcomes. Individual batch job status with processing times and status Figure 4.
Information related to user experience, transaction parameters, and business process parameters has been an unretrieved treasure, now accessible through new and unique AI-powered contextual analytics in Dynatrace. Lack of visibility into business processes to improve, optimize, and remediate issues and systems harms business success.
However, getting reliable answers from observability data so teams can automate more processes to ensure speed, quality, and reliability can be challenging. SRE applies software engineering principles to operations and infrastructure processes. Unpacking the purpose and importance of an IT cultural revolution – blog.
In this blog post, we explain how the unique combination of causal, predictive, and generative AIaugmented by the latest Davis AI advancementsis transforming how Dynatrace customers manage and optimize their IT infrastructure. Traditional forecasting engines typically depend on historical data, stored in metrics.
Effectively automating IT processes is key to addressing the challenges of complex cloud environments. Relying on manual processes results in outages, increased costs, and frustrated customers. These three types of AI used together enable more effective IT automation than a single form of AI on its own. What is causal AI?
Greenplum Database is a massively parallel processing (MPP) SQL database that is built and based on PostgreSQL. In this blog post, we explain what Greenplum is, and break down the Greenplum architecture, advantages, major use cases, and how to get started. You can leverage as few as two segment hosts and scale to an unlimited capacity.
In the last blog post of this series, we delved into how Dynatrace, functioning as a deploy-stage orchestrator, solves the challenges confronted by Site Reliability Engineers (SREs) during the early of automating CI/CD processes. This slow feedback and time spent rerunning tests can hinder the overall software deployment process.
Read on for links to blog posts that highlight the key benefits you get with our next-generation AI causation engine. These blog posts, published over the course of this year, span a huge feature set comprising Davis 2.0, Dynatrace will target the end of Davis 1.0 for around the middle of 2020. Key benefits of the Dynatrace Davis 2.0
We organize all of the trending information in your field so you don't have to. Join 5,000+ users and stay up to date on the latest articles your peers are reading.
You know about us, now we want to get to know you!
Let's personalize your content
Let's get even more personalized
We recognize your account from another site in our network, please click 'Send Email' below to continue with verifying your account and setting a password.


Let's personalize your content