This site uses cookies to improve your experience. To help us insure we adhere to various privacy regulations, please select your country/region of residence. If you do not select a country, we will assume you are from the United States. Select your Cookie Settings or view our Privacy Policy and Terms of Use.
Cookie Settings
Cookies and similar technologies are used on this website for proper function of the website, for tracking performance analytics and for marketing purposes. We and some of our third-party providers may use cookie data for various purposes. Please review the cookie settings below and choose your preference.
Used for the proper function of the website
Used for monitoring website traffic and interactions
Cookie Settings
Cookies and similar technologies are used on this website for proper function of the website, for tracking performance analytics and for marketing purposes. We and some of our third-party providers may use cookie data for various purposes. Please review the cookie settings below and choose your preference.
Strictly Necessary: Used for the proper function of the website
Performance/Analytics: Used for monitoring website traffic and interactions
This blog post will explore these exciting developments and what they mean for organizations. By automating OneAgent deployment at the image creation stage, organizations can immediately equip every EC2 instance with real-time monitoring and AI-powered analytics. group of companies.
Synthetic monitoring can help to confirm your applications are performing as intended and, in the event they’re not, help you quickly figure out what’s going on. Here’s a look at what synthetic monitoring is, how it’s different from real-user monitoring, and why it matters to your business.
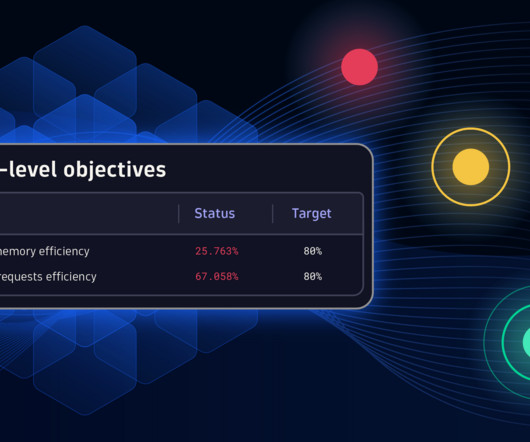
Service-level objectives are typically used to monitor business-critical services and applications. However, due to the fact that they boil down selected indicators to single values and track error budget levels, they also offer a suitable way to monitor optimization processes while aligning on single values to meet overall goals.
BT, the UK’s largest mobile and fixed broadband provider, faced this challenge when managing multiple monitoring tools across different teams. Their migration to AWS faced numerous challenges, such as identifying underutilized resources and streamlining performance monitoring.
In this blog, we will focus on histograms and why to use them. Histograms are commonly used to define and monitor service-level objectives (SLOs). Histograms also enhance the self-monitoring capabilities of the Collector. See this blog about exporting the data from the demo app to Dynatrace.
Recently, we’ve expanded our digital experience monitoring to cover the entire customer journey, from conversion to fulfillment. Consolidate real-user monitoring, synthetic monitoring, session replay, observability, and business process analytics tools into a unified platform. See the overview on the homepage.
Access policies for Dynatrace Grail™ data lakehouse are still available as service-related policies; they allow you to control access to the monitoring data on a per-data-source level, for example, logs and metrics. This blog post is part of our series on Tailored access management.
As businesses compete for customer loyalty, it’s critical to understand the difference between real-user monitoring and synthetic user monitoring. However, not all user monitoring systems are created equal. What is real user monitoring? Real-time monitoring of user application and service interactions.
In a recent blog post, we announced and demonstrated how the new Distributed Tracing app provides effortless trace insights. The Service Level Monitoring section contains the following charts: Top Spans: An overview of the most frequent spans ingested into Dynatrace. The file can be downloaded here.
This trend is prompting advances in both observability and monitoring. But exactly what are the differences between observability vs. monitoring? Monitoring and observability provide a two-pronged approach. To get a better understanding of observability vs monitoring, we’ll explore the differences between the two.
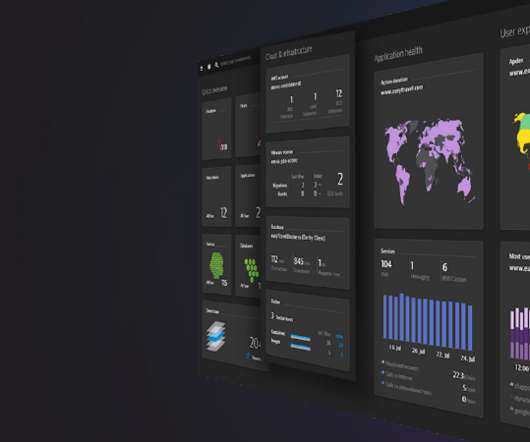
With Dashboards , you can monitor business performance, user interactions, security vulnerabilities, IT infrastructure health, and so much more, all in real time. In this blog series, we’ll guide you through creating powerful dashboards that transform complex data into actionable insights. Create a new dashboard.
The urgency of monitoring these batch jobs can’t be overstated. Monitor batch jobs Monitoring is critical for batch jobs because it ensures that essential tasks, such as data processing and system maintenance, are completed on time and without errors. This blog post offers further details about DPL architect.
Have a look at our recent Davis CoPilot blog post for more information and practical use cases. For example, if you’re monitoring network traffic and the average over the past 7 days is 500 Mbps, the threshold will adapt to this baseline. For instance, in a web shop, sales might vary by day of the week.
In this blog post, we look at these enhancements, exploring methods for monitoring your Kubernetes environment and showcasing how modern dashboards can transform your data. Leverage dashboards to monitor your environment in real time through log data.
Log monitoring, log analysis, and log analytics are more important than ever as organizations adopt more cloud-native technologies, containers, and microservices-based architectures. What is log monitoring? Log monitoring is a process by which developers and administrators continuously observe logs as they’re being recorded.
Business process monitoring and optimization. Monitor and optimize business processes with real-time visibility into process KPIs and detailed analytics for each step to improve customer satisfaction, increase operational efficiency, and reduce cost. For more details about OpenPipeline read this Dynatrace OpenPipeline blog post.
It gives you visibility into which components are monitored and which are not and helps automate time-consuming compliance configuration checks. Discovery & Coverage helps prevent unexpected outages by detecting and remediating monitoring coverage gaps across your entire enterprise.
DIY mobile app monitoring breeds complexity. In this case, mobile development teams often resort to costly do-it-yourself approaches where they attempt to put together different types of tooling to try to manage and monitor the mobile apps. An automated, all-in-one approach to mobile app monitoring.
Our customers use Dynatrace Synthetic Monitoring for 24/7 monitoring of their websites, web applications, and API endpoints. In a typical setup, the team that maintains synthetic monitors and furnishes them with application credentials is different from the team managing and rotating company secrets in an external vault system.
Digital experience monitoring (DEM) allows an organization to optimize customer experiences by taking into account the context surrounding digital experience metrics. What is digital experience monitoring? Primary digital experience monitoring tools.
Many of our customers—the world’s largest enterprises—have embraced the Dynatrace SaaS approach to monitoring, which provides critical business insights powered by AI and automation for globally-distributed, heterogeneous IT landscapes. New self-monitoring environment provides out-of-the-box insights and custom alerting.
This blog post explains how Dynatrace simplifies log ingestion, whether youre onboarding logs from your infrastructure using OneAgent, cloud services using log forwarding, or driving open-source standardization leveraging OpenTelemetry (OTel), Fluent Bit, or any other API-based ingestion methods. Configuration is fully customizable.
Organizations can now accelerate innovation and reduce the risk of failed software releases by incorporating on-demand synthetic monitoring as a metrics provider for automatic, continuous release-validation processes. Dynatrace combines Synthetic Monitoring with automatic release validation for continuous quality assurance across the SDLC.
Take your monitoring, data exploration, and storytelling to the next level with outstanding data visualization All your applications and underlying infrastructure produce vast volumes of data that you need to monitor or analyze for insights. We will release another dedicated blog post in the next few days.
Part 3: System Strategies and Architecture By: VarunKhaitan With special thanks to my stunning colleagues: Mallika Rao , Esmir Mesic , HugoMarques This blog post is a continuation of Part 2 , where we cleared the ambiguity around title launch observability at Netflix. Implement proactive monitoring for each of these endpoints.
Mobile app monitoring and mobile analytics make this possible. With the right monitoring solution, you can get ahead of problems to help increase overall app adoption and user satisfaction. What is mobile app monitoring? Mobile app monitoring is the process of collecting and analyzing data about application performance.
For more details, see our recent blog post explaining how new Dynatrace capabilities help modern app teams analyze OpenTelemetry traces and log data at scale. Automatic data capture and display: More data, including span attributes, is available for out-of-the-box analysis, with no additional configuration necessary.
This blog dives deep into serverless app monitoring and the tools that can help you monitor and troubleshoot effectively. Serverless architectures offload routine tasks from developers and let them focus on app building. They offer scalable, flexible, and cost-effective solutions that eliminate the need to manage servers.
Real-time monitoring : The periodic reports from cloud service providers lack real-time monitoring and actionable insights, limiting IT teams’ ability to make immediate adjustments to reduce carbon footprints. Youll be able to read more about our approach to cloud cost optimization in an upcoming blog post.
Dynatrace is proud to provide deep monitoring support for Azure Linux as a container host operating system (OS) platform for Azure Kubernetes Services (AKS) to enable customers to operate efficiently and innovate faster. Why monitor Azure Linux container host for AKS? How Can Dynatrace Monitor Azure Linux container host for AKS?
In this blog post, we will see how Dynatrace harnesses the power of observability and analytics to tailor a new experience to easily extend to the left, allowing developers to solve issues faster, build more efficient software, and ultimately improve developer experience!
Observability platforms address the challenge of message queue monitoring by capturing and analyzing queue data. It automatically discovers and monitors message queues and uses AI to instantly identify issues and their impact on applications and user experience. The importance of an observability platform approach. Watch webinar now!
Observability platforms address the challenge of message queue monitoring by capturing and analyzing queue data. It automatically discovers and monitors message queues and uses AI to instantly identify issues and their impact on applications and user experience. The importance of an observability platform approach.
SLO monitoring and alerting on SLOs using error-budget burn rates are critical capabilities that can help organizations achieve that goal. Without implementing robust SLO monitoring, anomaly detection, and alerting on SLOs, teams can miss issues that breach defined quality targets. What is SLO monitoring?
In our latest research, we analyzed social media, blogs, and other online sources to identify early indicators of such vulnerabilities. To detect any possible effects of the vulnerability before it was published, we cross-referenced data from multiple sources, scraping Jira, Mastodon, GitHub, and various security blogs.
Particularly during the COVID-19 pandemic, we’ve seen how poor application performance can impact business bottom lines and lead to lost revenue for many organizations, as laid out in our recent blog post about digital experience. Improve Core Web Vitals timings using Synthetic Monitoring. Synthetic Monitoring. contentful?paint
Properly monitoring a Kubernetes cluster or any related environment can be difficult. Service-level objectives (SLOs) are often used to monitor business-critical services and applications for customers. However, they can also be used to monitor optimization processes effectively.
By: Rajiv Shringi , Oleksii Tkachuk , Kartik Sathyanarayanan Introduction In our previous blog post, we introduced Netflix’s TimeSeries Abstraction , a distributed service designed to store and query large volumes of temporal event data with low millisecond latencies. For more information regarding this, refer to our previous blog.
In this blog post, well explore how these features boost productivity and accelerate access to the right data sets using shortcuts like segments. The dev-staging cluster isnt monitored regularly or included in an existing segment. Field-specific operators You can use advanced matching options, such as for tags: host.
Although some people may think of observability as a buzzword for sophisticated application performance monitoring (APM) , there are a few key distinctions to keep in mind when comparing observability and monitoring. What is the difference between monitoring and observability? Is observability really monitoring by another name?
They now use modern observability to monitor expanding cloud environments in order to operate more efficiently, innovate faster and more securely, and to deliver consistently better business results. There are simply too many disparate sources of information to successfully manage and monitor without automation.
RabbitMQ can be deployed in distributed environments and includes monitoring tools through a built-in dashboard and CLI. They include built-in management tools that simplify monitoring and troubleshooting, making them suitable for various enterprise applications. These tools help ensure proactive monitoring and quick issue resolution.
The next phase of my amazement involves deep introspection into a monitoring and observability solution called Dynatrace. The market offers plenty of monitoring solutions that can link a specific monitored event with a specific scripted action. Dynatrace monitors relevant aspects of the system and aggregates historical data.
We organize all of the trending information in your field so you don't have to. Join 5,000+ users and stay up to date on the latest articles your peers are reading.
You know about us, now we want to get to know you!
Let's personalize your content
Let's get even more personalized
We recognize your account from another site in our network, please click 'Send Email' below to continue with verifying your account and setting a password.


Let's personalize your content