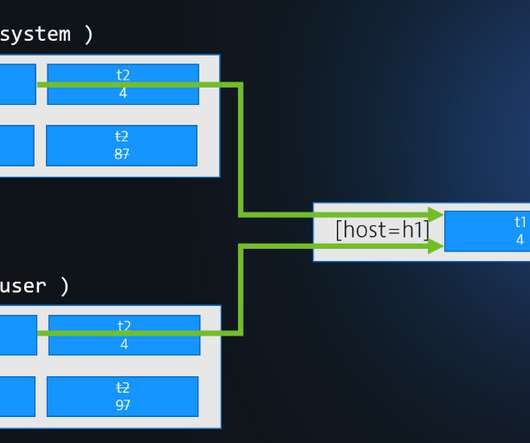
Metric Expressions explained
Dynatrace
AUGUST 20, 2021
The post Metric Expressions explained appeared first on Dynatrace blog. Dynatrace news.
This site uses cookies to improve your experience. To help us insure we adhere to various privacy regulations, please select your country/region of residence. If you do not select a country, we will assume you are from the United States. Select your Cookie Settings or view our Privacy Policy and Terms of Use.
Cookies and similar technologies are used on this website for proper function of the website, for tracking performance analytics and for marketing purposes. We and some of our third-party providers may use cookie data for various purposes. Please review the cookie settings below and choose your preference.
Used for the proper function of the website
Used for monitoring website traffic and interactions
Cookies and similar technologies are used on this website for proper function of the website, for tracking performance analytics and for marketing purposes. We and some of our third-party providers may use cookie data for various purposes. Please review the cookie settings below and choose your preference.
Dynatrace
AUGUST 20, 2021
The post Metric Expressions explained appeared first on Dynatrace blog. Dynatrace news.

Dynatrace
OCTOBER 1, 2021
In IT and cloud computing, observability is the ability to measure a system’s current state based on the data it generates, such as logs, metrics, and traces. If you’ve read about observability, you likely know that collecting the measurements of logs, metrics, and distributed traces are the three key pillars to achieving success.
This site is protected by reCAPTCHA and the Google Privacy Policy and Terms of Service apply.

Dynatrace
JANUARY 17, 2023
The release candidate of OpenTelemetry metrics was announced earlier this year at Kubecon in Valencia, Spain. Since then, organizations have embraced OTLP as an all-in-one protocol for observability signals, including metrics, traces, and logs, which will also gain Dynatrace support in early 2023. What’s ahead in 2023.
Dynatrace
MAY 18, 2022
With the most important components becoming release candidates , Dynatrace now supports the full OpenTelemetry specification on all runtimes and automatically adds intelligence to metrics at enterprise scale. So these metrics are immensely valuable to SRE and DevOps teams. Automation and intelligence for metrics at enterprise scale.

DZone
JULY 3, 2022
This is the second in a series of blogs discussing unified observability with microservices and the Oracle database. This second blog will take a deeper dive into the Metrics, Logs, and Tracing exporters (which can be found at [link] ), describing them and showing how to configure them, Grafana, alerts, etc.

Dynatrace
NOVEMBER 16, 2021
Dynatrace has recently extended its Kubernetes operator by adding a new feature, the Prometheus OpenMetrics Ingest , which enables you to import Prometheus metrics in Dynatrace and build SLO and anomaly detection dashboards with Prometheus data. Here we’ll explore how to collect Prometheus metrics and what you can achieve with them.

Dynatrace
SEPTEMBER 1, 2021
The post Better metrics, better charts – Dynatrace a new Amazon Managed Grafana partner appeared first on Dynatrace blog. Dynatrace news.

Dynatrace
OCTOBER 21, 2021
There’s no lack of metrics, logs, traces, or events when monitoring your Kubernetes (K8s) workloads. I was pulled into that troubleshooting call and started taking notes and screenshots so I can share how easy it is to troubleshoot the Kubernetes workload with our engineers and you – our readers – on this blog post. Dynatrace news.

Dynatrace
APRIL 7, 2022
Micrometer is used for instrumenting both out-of-the-box and custom metrics from Spring Boot applications. Davis topology-aware anomaly detection and alerting for your Micrometer metrics. Topology-related custom metrics for seamless reports and alerts. Micrometer uses a registry to export metrics to monitoring systems.
Dynatrace
AUGUST 2, 2021
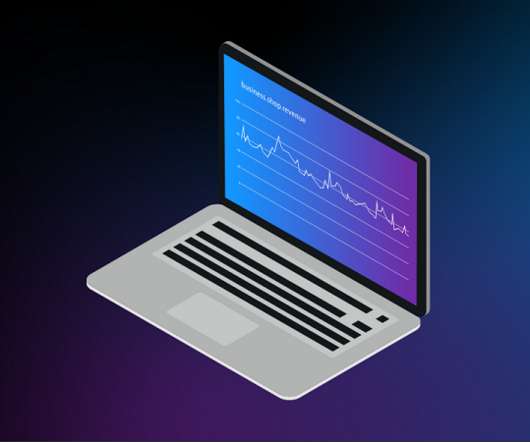
Metrics matter. But without complex analytics to make sense of them in context, metrics are often too raw to be useful on their own. To achieve relevant insights, raw metrics typically need to be processed through filtering, aggregation, or arithmetic operations. Examples of metric calculations. Dynatrace news.

Dynatrace
MARCH 16, 2022
Now, Dynatrace has the ability to turn numerical values from logs into metrics, which unlocks AI-powered answers, context, and automation for your apps and infrastructure, at scale. Whatever your use case, when log data reflects changes in your infrastructure or business metrics, you need to extract the metrics and monitor them.

Dynatrace
OCTOBER 15, 2021
Loosely defined, observability is the ability to understand what’s happening inside a system from the knowledge of the external data it produces, which are usually logs, metrics, and traces. Logs, metrics, and traces make up the bulk of all telemetry data. The data life cycle has multiple steps from start to finish.

Dynatrace
DECEMBER 18, 2023
To get a more granular look into telemetry data, many analysts rely on custom metrics using Prometheus. Named after the Greek god who brought fire down from Mount Olympus, Prometheus metrics have been transforming observability since the project’s inception in 2012.
Dynatrace
JUNE 3, 2022
The post Identify issues immediately with actionable metrics and context in Dynatrace Problem view appeared first on Dynatrace blog. To learn more about how Dynatrace can help optimize your user experiences across mobile, web, IoT, and APIs, visit Dynatrace Digital Experience Monitoring (DEM) or sign up for a 15-day free trial.

Dynatrace
JULY 14, 2022
We also explore how to improve user experiences within the Zero Trust framework and how to develop security metrics that eliminate DevSecOps bottlenecks. Episode 40 – Security Metrics: Measure Twice, Cut Once with Rick Stewart. Security Metrics: Measure Twice, Cut Once with Rick Stewart. appeared first on Dynatrace blog.

The Netflix TechBlog
JUNE 14, 2023
This blog post will share broadly-applicable techniques (beyond GraphQL) we used to perform this migration. So, we relied on higher-level metrics-based testing: AB Testing and Sticky Canaries. To determine customer impact, we could compare various metrics such as error rates, latencies, and time to render.

Dynatrace
FEBRUARY 2, 2022
Dynatrace captures all your data, including host and application metrics, basic-network metrics, real-user metrics, mobile metrics, cloud-infrastructure metrics, log metrics, and much more. The post Dynatrace SaaS on Azure now Generally Available appeared first on Dynatrace blog.

The Netflix TechBlog
MAY 4, 2023
This blog series will examine the tools, techniques, and strategies we have utilized to achieve this goal. The second phase involves migrating the traffic over to the new systems in a manner that mitigates the risk of incidents while continually monitoring and confirming that we are meeting crucial metrics tracked at multiple levels.

Dynatrace
OCTOBER 7, 2020
Open-source metric sources automatically map to our Smartscape model for AI analytics. We’ve just enhanced Dynatrace OneAgent with an open metric API. Here’s a quick overview of what you can achieve now that the Dynatrace Software Intelligence Platform has been extended to ingest third-party metrics. Dynatrace news.

DZone
AUGUST 29, 2021
In this blog post, we’ll examine one such case where we use the Sentry JavaScript SDK to instrument Jest (which runs our frontend test suite) and how we addressed the issues that we found. We have high-level metrics for how well (or not) our CI is performing.

Dynatrace
MARCH 29, 2024
Check out the following related resources to learn more: Enhancing Duet AI for Developers through our partner ecosystem – Google blog Learn more about the powerful synergy that revolutionizes the cloud landscape when integrating Dynatrace observability with Vertex and Duet AI. Learn more.

The Netflix TechBlog
JUNE 13, 2023
Our previous blog post presented replay traffic testing — a crucial instrument in our toolkit that allows us to implement these transformations with precision and reliability. This blog post will delve into the techniques leveraged at Netflix to introduce these changes to production.

Dynatrace
SEPTEMBER 28, 2021
Teams are using concepts from site reliability engineering to create SLO metrics that measure the impact to their customers and leverage error budgets to balance innovation and reliability. Nobl9 integrates with Dynatrace to gather SLI metrics for your infrastructure and applications using real-time monitoring or synthetics.
The Netflix TechBlog
APRIL 27, 2023
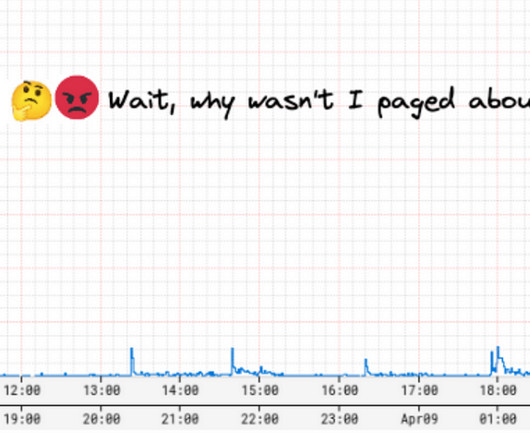
A few years ago, we were paged by our SRE team due to our Metrics Alerting System falling behind — critical application health alerts reached engineers 45 minutes late! Hence, we started down the path of alert evaluation via real-time streaming metrics. The internals here are outside the scope of this blog post.

Dynatrace
JULY 1, 2020
In my last blog , I’ve provided an example of this happening, whereby the traffic spiked and quadrupled the usual incoming traffic. These are all interesting metrics from marketing point of view, and also highly interesting to you as they allow you to engage with the teams that are driving the traffic against your IT-system.

DZone
AUGUST 4, 2022
Spark-Radiant will help optimize performance and cost considering catalyst optimizer rules, enhance auto-scaling in Spark, collect important metrics related to a Spark job, Bloom filter index in Spark, etc. In this blog, I will discuss the availability of Spark-Radiant 1.0.4, Spark-Radiant is now available and ready to use.

DZone
FEBRUARY 20, 2023
Disclaimer: All the views and opinions expressed in the blog belong solely to the author and not necessarily to the author's employer or any other group or individual. Once the one-time configuration is done, metric data will be available in the monitoring account automatically.

DZone
SEPTEMBER 17, 2024
Having not enough memory directly affects every performance metric and negatively impacts the performance. In this blog post, we are going to understand how databases (and PostgreSQL specifically) manage memory and how to troubleshoot low free-memory scenarios. Memory usage is one of the most important aspects of the database system.

Dynatrace
OCTOBER 6, 2023
Custom data buckets for faster queries, increased control, and custom retention periods The first layer in the Grail data model consists of buckets and tables (and views for entities, which is outside this blog post’s scope). Special thanks to Dominik Punz and Christian Kiesewetter for their contributions to this blog post.

Dynatrace
FEBRUARY 19, 2021
Particularly during the COVID-19 pandemic, we’ve seen how poor application performance can impact business bottom lines and lead to lost revenue for many organizations, as laid out in our recent blog post about digital experience. with: Aggregated field metrics?rather?than?valuable?details Metrics and recommendations?rather

Dynatrace
NOVEMBER 15, 2021
The ops team understood the concept of business metrics like NPS, conversions rates, even call center volume—but believed these KPIs were meant for other teams. Similarly, IT’s solid SLOs and Apdex scores—important metrics agreed upon by the app owner and IT—were met with a lack of enthusiasm by the business team.

Dynatrace
FEBRUARY 14, 2022
Building on its advanced analytics capabilities for Prometheus data , Dynatrace now enables you to create extensions based on Prometheus metrics. Many technologies expose their metrics in the Prometheus data format. Easily gain actionable insights with the Dynatrace Extension for Prometheus metrics. Prometheus in Kubernetes ?and
The Netflix TechBlog
SEPTEMBER 10, 2024
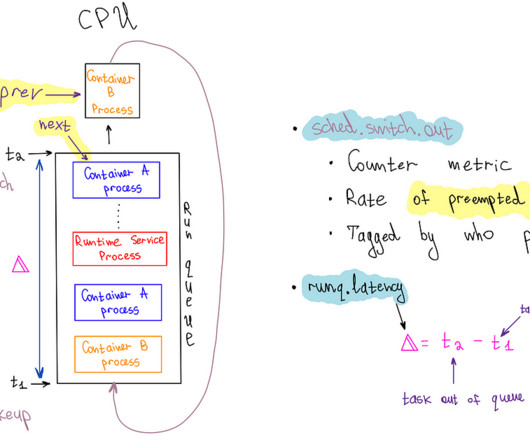
In this blog post, we'll reveal how we leveraged eBPF to achieve continuous, low-overhead instrumentation of the Linux scheduler, enabling effective self-serve monitoring of noisy neighbor issues. To emit a run queue latency metric, we leveraged three eBPF hooks: sched_wakeup, sched_wakeup_new, and sched_switch.

Dynatrace
MAY 17, 2022
From a cost perspective, internal customers waste valuable time sending tickets to operations teams asking for metrics, logs, and traces to be enabled. A team looking for metrics, traces, and logs no longer needs to file a ticket to get their app monitored in their own environments. This approach is costly and error prone.
Dynatrace
APRIL 21, 2021
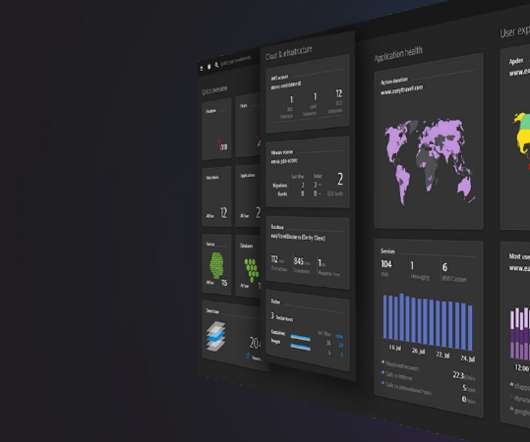
In February 2021, Dynatrace announced full support for Google’s Core Web Vitals metrics , which will help site owners as they start optimizing Core Web Vitals performance for SEO. Dynatrace Business Insights views summarize top Core Web Vitals metrics and scores with 100% precision. Dynatrace news. 28-day lookbacks. 75 th percentile.
Dynatrace
MAY 7, 2024
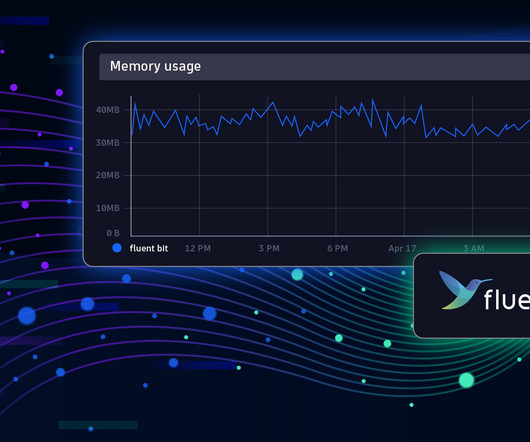
Fluent Bit is a telemetry agent designed to receive data (logs, traces, and metrics), process or modify it, and export it to a destination. Fluent Bit and Fluentd were created for the same purpose: collecting and processing logs, traces, and metrics. Observability: Elevating Logs, Metrics, and Traces! What is Fluent Bit?

Dynatrace
MAY 5, 2021
In fact, for most of us, has become a priority, requiring us to expand our focus on observability to include business analytics metrics. To introduce the video part of this blog, here’s a (short) story about silos; does this one sound familiar? Is your organization’s story filled with villains or heroes? And now, the video….
Dynatrace
MARCH 22, 2021
Each SNMP-enabled device provides access to its state and performance metrics in a simple and robust way that allows Dynatrace to fetch the metrics and run them through Davis®, our AI causation engine. The post Simplified observability for your SNMP devices appeared first on Dynatrace blog. Events and alerts.

Dynatrace
FEBRUARY 8, 2021
Every service and component exposes observability data (metrics, logs, and traces) that contains crucial information to drive digital businesses. The “three pillars of observability,” metrics, logs, and traces, still don’t tell the whole story. Track log metrics and receive alerts without manually setting thresholds.

Dynatrace
NOVEMBER 3, 2021
Monitoring focuses on watching specific metrics. Observability is the ability to understand a system’s internal state by analyzing the data it generates, such as logs, metrics, and traces. For example, we can actively watch a single metric for changes that indicate a problem — this is monitoring.
Dynatrace
OCTOBER 16, 2024
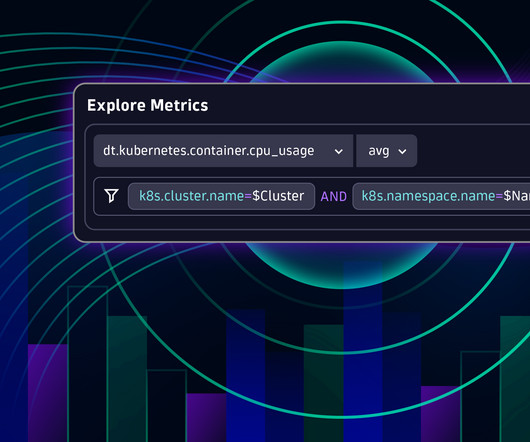
In this blog post, we look at these enhancements, exploring methods for monitoring your Kubernetes environment and showcasing how modern dashboards can transform your data. Next, let’s use the Kubernetes app to investigate more metrics.
Dynatrace
SEPTEMBER 4, 2020
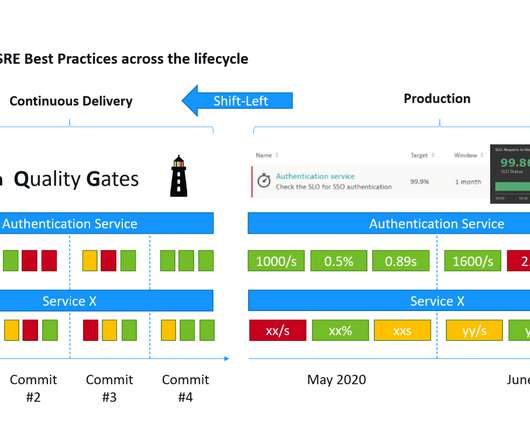
In this blog, I want to dig a bit into a core capability of Keptn which is used across all use cases: SLI/SLO-based Evaluations for Quality Gates as well as Auto-Remediation. While an SLI is just a metric, an SLO just a threshold you expect your SLI to be in and SLA is just the business contract on top of an SLO.

Dynatrace
MAY 13, 2022
Once you deploy the Dynatrace extension, Dynatrace ingests your Cassandra metrics and analyzes them in context with the entire stack. From there, you can dive deeper into infrastructure metrics (cluster, datacenter, racks, and nodes) and data metrics (keyspaces and tables). Seeing the value.

Dynatrace
NOVEMBER 19, 2021
Custom events for alerting using the Build tab and advanced query mode now apply the same metric dimension limits that are applied to Code -tab-based configurations. Prometheus metrics from exporters in Kubernetes that aren’t running on a OneAgent-monitored node now consume DDUs. Local self-monitoring metrics. Use dt.entity.<entity_type>
Expert insights. Personalized for you.
We have resent the email to
Are you sure you want to cancel your subscriptions?


Let's personalize your content