This site uses cookies to improve your experience. To help us insure we adhere to various privacy regulations, please select your country/region of residence. If you do not select a country, we will assume you are from the United States. Select your Cookie Settings or view our Privacy Policy and Terms of Use.
Cookie Settings
Cookies and similar technologies are used on this website for proper function of the website, for tracking performance analytics and for marketing purposes. We and some of our third-party providers may use cookie data for various purposes. Please review the cookie settings below and choose your preference.
Used for the proper function of the website
Used for monitoring website traffic and interactions
Cookie Settings
Cookies and similar technologies are used on this website for proper function of the website, for tracking performance analytics and for marketing purposes. We and some of our third-party providers may use cookie data for various purposes. Please review the cookie settings below and choose your preference.
Strictly Necessary: Used for the proper function of the website
Performance/Analytics: Used for monitoring website traffic and interactions
Migrating Critical Traffic At Scale with No Downtime — Part 1 Shyam Gala , Javier Fernandez-Ivern , Anup Rokkam Pratap , Devang Shah Hundreds of millions of customers tune into Netflix every day, expecting an uninterrupted and immersive streaming experience. The batch job creates a high-level summary that captures some key comparison metrics.
The data platform is built on top of several distributed systems, and due to the inherent nature of these systems, it is inevitable that these workloads run into failures periodically. This blog will explore these two systems and how they perform auto-diagnosis and remediation across our BigData Platform and Real-time infrastructure.
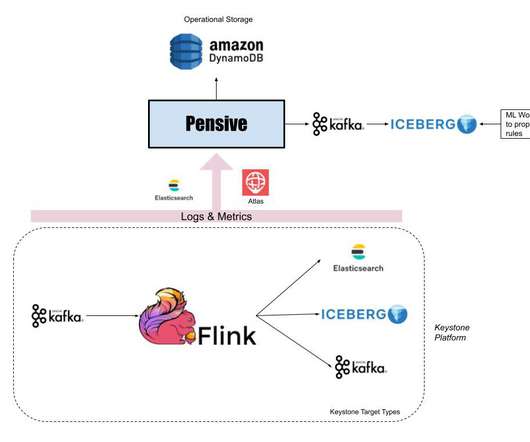
The Flow Exporter also publishes various operational metrics to Atlas. These metrics are visualized using Lumen , a self-service dashboarding infrastructure. After several iterations of the architecture and some tuning, the solution has proven to be able to scale. So how do we ingest and enrich these flows at scale ?
How do you get more value from petabytes of exponentially exploding, increasingly heterogeneous data? The short answer: The three pillars of observability—logs, metrics, and traces—converging on a data lakehouse. To solve this problem, Dynatrace launched Grail, its causational data lakehouse , in 2022.
If you want to see a more hands-on approach, I encourage you to watch the recording as Stefano did a live demo of Akamas’s integration with Dynatrace, showing how to minimize the footprint of a Java application with automated JVM tuning. Akamas also enables you to automate the analysis of the experiment metrics in powerful ways.
One example is the Spectator Python client library, a library for instrumenting code to record dimensional time series metrics. Our Infrastructure Security team leverages Python to help with IAM permission tuning using Repokid. These libraries are the primary way users interface programmatically with work in the BigData platform.
Building and Scaling Data Lineage at Netflix to Improve Data Infrastructure Reliability, and Efficiency By: Di Lin , Girish Lingappa , Jitender Aswani Imagine yourself in the role of a data-inspired decision maker staring at a metric on a dashboard about to make a critical business decision but pausing to ask a question?—?“Can
Using Grail to heal observability pains Grail logs not only store bigdata, but also map out dependencies to enable fast analytics and data reasoning. Business leaders can decide which logs they want to use and tune storage to their data needs. Seamless integration. ” Watch session now!
A daily process ranks the records by timestamp to generate a data frame of compacted records. Old data files are overwritten with a set of new data files that contain only the compacted data. Data Quality Data Mesh provides metrics and dashboards at both the processor and pipeline level for operational observability.
For example, a job would reprocess aggregates for the past 3 days because it assumes that there would be late arriving data, but data prior to 3 days isn’t worth the cost of reprocessing. Backfill: Backfilling datasets is a common operation in bigdata processing.
Take, for example, The Web Almanac , the golden collection of BigData combined with the collective intelligence from most of the authors listed below, brilliantly spearheaded by Google’s @rick_viscomi. How to pioneer new metrics and create a culture of performance. Web Performance Tuning. Time is Money.
Operating Delta applications is made simple for users as the framework provides resilience and failure tolerance out of the box and collects many granular metrics that can be used for alerts. Please stay tuned. Below is a view of the high level architecture of the Delta platform.
Developers representing hundreds of companies work together at these meetups to become masters in performance metrics and the latest trends in measuring site speed.) And, of course, you should follow him on Twitter @ igrigorik for in-depth insights on web performance metrics, user experience, and industry news. Maximiliano Firtman.
Discover data sources to gain insights into your resource efficiency and environmental impact, including the AWS Customer Carbon Footprint Tool and proxy metrics from the AWS Cost & Usage Reports. Discover how Scepter, Inc. Raman Pujani, Solutions Architect, AWS NOTE: This is an interesting new topic. See you there!
We organize all of the trending information in your field so you don't have to. Join 5,000+ users and stay up to date on the latest articles your peers are reading.
You know about us, now we want to get to know you!
Let's personalize your content
Let's get even more personalized
We recognize your account from another site in our network, please click 'Send Email' below to continue with verifying your account and setting a password.


Let's personalize your content