This site uses cookies to improve your experience. To help us insure we adhere to various privacy regulations, please select your country/region of residence. If you do not select a country, we will assume you are from the United States. Select your Cookie Settings or view our Privacy Policy and Terms of Use.
Cookie Settings
Cookies and similar technologies are used on this website for proper function of the website, for tracking performance analytics and for marketing purposes. We and some of our third-party providers may use cookie data for various purposes. Please review the cookie settings below and choose your preference.
Used for the proper function of the website
Used for monitoring website traffic and interactions
Cookie Settings
Cookies and similar technologies are used on this website for proper function of the website, for tracking performance analytics and for marketing purposes. We and some of our third-party providers may use cookie data for various purposes. Please review the cookie settings below and choose your preference.
Strictly Necessary: Used for the proper function of the website
Performance/Analytics: Used for monitoring website traffic and interactions
In fact, according to a Dynatrace global survey of 1,300 CIOs , 99% of enterprises utilize a multicloud environment and seven cloud monitoring solutions on average. What is cloud monitoring? Cloud monitoring is a set of solutions and practices used to observe, measure, analyze, and manage the health of cloud-based IT infrastructure.
More than 90% of enterprises now rely on a hybrid cloud infrastructure to deliver innovative digital services and capture new markets. That’s because cloud platforms offer flexibility and extensibility for an organization’s existing infrastructure. Dynatrace news. With public clouds, multiple organizations share resources.
With 99% of organizations using multicloud environments , effectively monitoring cloud operations with AI-driven analytics and automation is critical. This operational data could be gathered from live running infrastructures using software agents, hypervisors, or network logs, for example. How does IT operations analytics work?
Application Performance Monitoring (APM) in its simplest terms is what practitioners use to ensure consistent availability, performance, and response times to applications. Websites, mobile apps, and business applications are typical use cases for monitoring. Performance monitoring. Application monitoring. Dynatrace news.
Software analytics offers the ability to gain and share insights from data emitted by software systems and related operational processes to develop higher-quality software faster while operating it efficiently and securely. This involves bigdata analytics and applying advanced AI and machine learning techniques, such as causal AI.
Monitoring and logging are fundamental building blocks of observability. Adding AIOps to automation processes makes the volume of data that applications and multicloud environments generate much less overwhelming. Similarly, digital experience monitoring is another ongoing process that lends itself to IT automation.
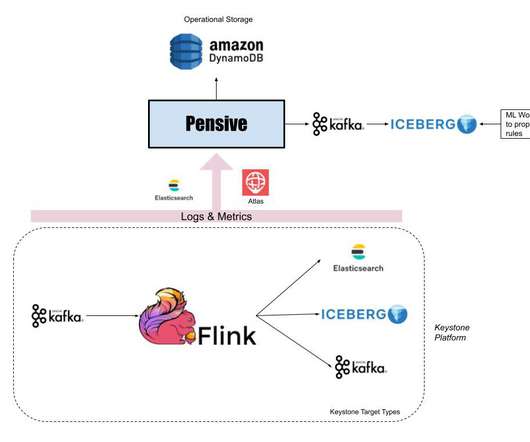
Pensive infrastructure comprises two separate systems to support batch and streaming workloads. This blog will explore these two systems and how they perform auto-diagnosis and remediation across our BigData Platform and Real-time infrastructure. If it crosses a threshold, Atlas sends a notification to Streaming Pensive.
Log management and analytics is an essential part of any organization’s infrastructure, and it’s no secret the industry has suffered from a shortage of innovation for several years. Several pain points have made it difficult for organizations to manage their data efficiently and create actual value.
Application Performance Monitoring (APM) in its simplest terms is what practitioners use to ensure consistent availability, performance, and response times to applications. Websites, mobile apps, and business applications are typical use cases for monitoring. APM can be referred to as: Application performance monitoring.
ITOps is an IT discipline involving actions and decisions made by the operations team responsible for an organization’s IT infrastructure. Besides the traditional system hardware, storage, routers, and software, ITOps also includes virtual components of the network and cloud infrastructure. What is ITOps? Functionality.
Containers enable developers to package microservices or applications with the libraries, configuration files, and dependencies needed to run on any infrastructure, regardless of the target system environment. This orchestration includes provisioning, scheduling, networking, ensuring availability, and monitoring container lifecycles.
At much less than 1% of CPU and memory on the instance, this highly performant sidecar provides flow data at scale for network insight. Challenges The cloud network infrastructure that Netflix utilizes today consists of AWS services such as VPC, DirectConnect, VPC Peering, Transit Gateways, NAT Gateways, etc and Netflix owned devices.
With more automated approaches to log monitoring and log analysis, however, organizations can gain visibility into their applications and infrastructure efficiently and with greater precision—even as cloud environments grow. They enable IT teams to identify and address the precise cause of application and infrastructure issues.
An easy, though imprecise, way of thinking about Netflix infrastructure is that everything that happens before you press Play on your remote control (e.g., Various software systems are needed to design, build, and operate this CDN infrastructure, and a significant number of them are written in Python. are you logged in?
AIOps combines bigdata and machine learning to automate key IT operations processes, including anomaly detection and identification, event correlation, and root-cause analysis. Once products and services are live, IT teams must continuously monitor and manage them. What is AIOps, and how does it work?
. “We relied on customers (our players) to call us and let us know if something was broken and had scattered monitoring tools,” Mehdiabadi says. Mehdiabadi says the company can now easily forecast both frontend and backend data to see everything that’s going on. “Our players just see the frontend. .
While data lakehouses combine the flexibility and cost-efficiency of data lakes with the querying capabilities of data warehouses, it’s important to understand how these storage environments differ. Data warehouses. Data warehouses were the original bigdata storage option. Download report now!
Managing tool sprawl More observability tools means more data — and more complexity. To effectively monitor and manage these services, organizations often rely on multiple monitoring tools, each with its own feature set and focus. Here are the main functions teams can use to discover new insights: Data forecasting.
Intelligent Observability includes the ability to not only monitor applications but gain actionable insights that can be used to transform services and create great customer experiences. Vikash Chhaganlal , GM of Engineering and Infrastructure at Kiwibank said it. Investing in data is easy but using it is really hard”.
As teams try to gain insight into this data deluge, they have to balance the need for speed, data fidelity, and scale with capacity constraints and cost. To solve this problem, Dynatrace launched Grail, its causational data lakehouse , in 2022. But logs are just one pillar of the observability triumvirate.
Convergence of observability and security data is a must As digital transformation accelerates, most organizations house hybrid cloud environments for which observability and security are paramount concerns. This includes collecting metrics, logs, and traces from all applications and infrastructure components.
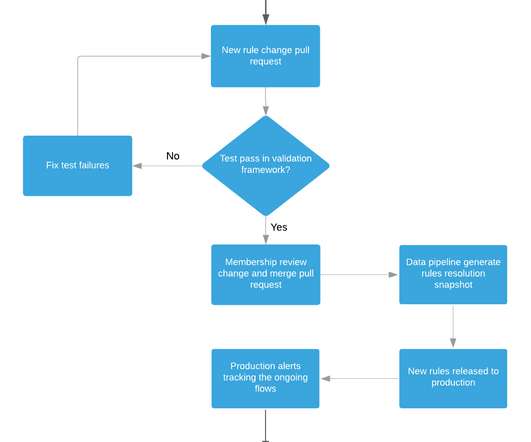
The changes are administered by the regular git pull request flow and guarded by the validation infrastructure. Observability/Validation Guardrails: A comprehensive validation infrastructure designed to ensure that SKURules changes are accurate and do not break existing behavior.
In November 2015, Amazon Web Services announced that it would launch a new AWS infrastructure region in the United Kingdom. Today, I'm happy to announce that the AWS Europe (London) Region, our 16th technology infrastructure region globally, is now generally available for use by customers worldwide.
I took a big-data-analysis approach, which started with another problem visualization. Statistically analyzing Dynatrace’s event and problem data. The color of the line reflects the impact of the problem: infrastructure, service or application. But that didn’t work for me. Visualizing problem noise.
Data Mesh provides a drag-and-drop, self-service user interface for exploring sources and creating pipelines so that users can focus on delivering business value without having to worry about managing and scaling complex data streaming infrastructure. The audits check for equality (i.e.
Gartner defines AIOps as the combination of “bigdata and machine learning to automate IT operations processes, including event correlation, anomaly detection, and causality determination.” The second challenge with traditional AIOps centers around the data processing cycle. But what is AIOps, exactly? What is AIOps?
AIOps (or “AI for IT operations”) uses artificial intelligence so that bigdata can help IT teams work faster and more effectively. Pediatricians use these applications to monitor the heart rate of child patients. This perfect storm of challenges has led to the accelerated adoption of artificial intelligence, including AIOps.
Consequently, if any node happens to fail, the remaining ones provide continued access to the saved information without risking service interruptions or permanent data loss. These distributed storage services also play a pivotal role in bigdata and analytics operations.
They keep the features that developers like but can handle much more data, similar to NoSQL systems. Notably, they simplify handling bigdata flows, offer consistent transactions, and sustain high performance even when they’re used for real-time data analysis and complex queries.
Key Takeaways A hybrid cloud platform combines private and public cloud providers with on-premises infrastructure to create a flexible, secure, cost-effective IT environment that supports scalability, innovation, and rapid market response. The architecture usually integrates several private, public, and on-premises infrastructures.
In November, Amazon Web Services announced that it would launch a new AWS infrastructure region in South Korea. Nexon uses AWS global infrastructure to manage its IT infrastructure more effectively, and they are now using AWS for their domestic workloads as well.
Often an application requires several infrastructure resources to be created and AWS CloudFormation helps customers create and manage these collections of AWS resources in a simple and predictable way. They also setup Auto Scaling, EC2 and RDS Security Groups, configure CloudWatch monitoring and alarms, and use SNS for notifications.
Seer: leveraging bigdata to navigate the complexity of performance debugging in cloud microservices Gan et al., When a QoS violation is predicted to occur and a culprit microservice located, Seer uses a lower level tracing infrastructure with hardware monitoring primitives to identify the reason behind the QoS violation.
We are increasingly surrounded by intelligent IoT devices, which have become an essential part of our lives and an integral component of business and industrial infrastructures. Real-Time Device Tracking with In-Memory Computing Can Fill an Important Gap in Today’s Streaming Analytics Platforms. The list goes on.
Scrapinghub is hiring a Senior Software Engineer (BigData/AI). You will be designing and implementing distributed systems : large-scale web crawling platform, integrating Deep Learning based web data extraction components, working on queue algorithms, large datasets, creating a development platform for other company departments, etc.
Scrapinghub is hiring a Senior Software Engineer (BigData/AI). You will be designing and implementing distributed systems : large-scale web crawling platform, integrating Deep Learning based web data extraction components, working on queue algorithms, large datasets, creating a development platform for other company departments, etc.
Scrapinghub is hiring a Senior Software Engineer (BigData/AI). You will be designing and implementing distributed systems : large-scale web crawling platform, integrating Deep Learning based web data extraction components, working on queue algorithms, large datasets, creating a development platform for other company departments, etc.
Scrapinghub is hiring a Senior Software Engineer (BigData/AI). You will be designing and implementing distributed systems : large-scale web crawling platform, integrating Deep Learning based web data extraction components, working on queue algorithms, large datasets, creating a development platform for other company departments, etc.
Scrapinghub is hiring a Senior Software Engineer (BigData/AI). You will be designing and implementing distributed systems : large-scale web crawling platform, integrating Deep Learning based web data extraction components, working on queue algorithms, large datasets, creating a development platform for other company departments, etc.
Scrapinghub is hiring a Senior Software Engineer (BigData/AI). You will be designing and implementing distributed systems : large-scale web crawling platform, integrating Deep Learning based web data extraction components, working on queue algorithms, large datasets, creating a development platform for other company departments, etc.
In this year's CFP we’re looking for topics covering the latest trends and best practices in cloud computing, containerization, machine learning, bigdata, infrastructure, scalability, DevOps, IT management, automation, reliability, monitoring, performance tuning, security, databases, programming, datacenters, and more.
In this year's CFP we’re looking for topics covering the latest trends and best practices in cloud computing, containerization, machine learning, bigdata, infrastructure, scalability, DevOps, IT management, automation, reliability, monitoring, performance tuning, security, databases, programming, datacenters, and more.
Machine Learning (ML) and Artificial Intelligence (AI) programme testing and QA teams will develop their automatic research techniques, keeping track with recurring updates — with the assistance of analytics and monitoring. It will make Artificial Intelligence the leading working group for assessing and deciding infrastructure.
Overview At Netflix, the Analytics and Developer Experience organization, part of the Data Platform, offers a product called Workbench. Workbench is a remote development workspace based on Titus that allows data practitioners to work with bigdata and machine learning use cases at scale.
We organize all of the trending information in your field so you don't have to. Join 5,000+ users and stay up to date on the latest articles your peers are reading.
You know about us, now we want to get to know you!
Let's personalize your content
Let's get even more personalized
We recognize your account from another site in our network, please click 'Send Email' below to continue with verifying your account and setting a password.


Let's personalize your content