This site uses cookies to improve your experience. To help us insure we adhere to various privacy regulations, please select your country/region of residence. If you do not select a country, we will assume you are from the United States. Select your Cookie Settings or view our Privacy Policy and Terms of Use.
Cookie Settings
Cookies and similar technologies are used on this website for proper function of the website, for tracking performance analytics and for marketing purposes. We and some of our third-party providers may use cookie data for various purposes. Please review the cookie settings below and choose your preference.
Used for the proper function of the website
Used for monitoring website traffic and interactions
Cookie Settings
Cookies and similar technologies are used on this website for proper function of the website, for tracking performance analytics and for marketing purposes. We and some of our third-party providers may use cookie data for various purposes. Please review the cookie settings below and choose your preference.
Strictly Necessary: Used for the proper function of the website
Performance/Analytics: Used for monitoring website traffic and interactions
These resources generate vast amounts of data in various locations, including containers, which can be virtual and ephemeral, thus more difficult to monitor. These challenges make AWS observability a key practice for building and monitoring cloud-native applications. Serverless technologies can reduce management complexity.
As organizations adopt more cloud-native technologies, the risk—and consequences—of cyberattacks are also increasing. Through this integration, Dynatrace enriches data collected by Microsoft Sentinel to provide organizations with enhanced data insights in context of their full technology stack. Runtime application protection.
As businesses compete for customer loyalty, it’s critical to understand the difference between real-user monitoring and synthetic user monitoring. These development and testing practices ensure the performance of critical applications and resources to deliver loyalty-building user experiences. What is real user monitoring?
The rapid evolution of cloud technology continues to shape how businesses operate and compete. AWS’ recent recognition of Dynatrace as the 2024 AWS EMEA Technology Partner of the Year highlights the joint commitment to accelerate customer cloud transformation.
Following FinOps practices, engineering, finance, and business teams take responsibility for their cloud usage, making data-driven spending decisions in a scalable and sustainable manner. Empowering teams to manage their FinOps practices, however, requires teams to have access to reliable multicloud monitoring and analysis data.
Because cyberattacks are increasing as application delivery gets more complex, it is crucial to put in place some cybersecurity bestpractices to protect your organization’s data and privacy. You can achieve this through a few bestpractices and tools. Application security monitoring. Use strong passwords.
Here, we’ll tackle the basics, benefits, and bestpractices of IAC, as well as choosing infrastructure-as-code tools for your organization. Infrastructure as code is a practice that automates IT infrastructure provisioning and management by codifying it as software. Exploring IAC bestpractices. Consistency.
By the time your SRE sets up these DevOps automation bestpractices, you have had to push unreliable releases into production. To avoid this scenario, your SRE’s first step should be to employ technologies and strategies that tame the complexity of multicloud DevOps environments. Next steps for DevOps automation bestpractices.
Docker, the main containerization technology, has transformed application packaging and deployment. While Docker makes it easier to execute apps, it is also critical to monitor and log your Dockerized environments to ensure they are working properly and stay safe.
The practice uses continuous monitoring and high levels of automation in close collaboration with agile development teams to ensure applications are highly available and perform without friction. Aligning site reliability goals with business objectives Because of this, SRE bestpractices align objectives with business outcomes.
Cost Allocation also unlocks new possibilities for strategic IT management , empowering you to align IT spending with your business priorities and serving as a fundamental prerequisite for adopting FinOps practices. Costs and their origin are transparent, and teams are fully accountable for the efficient usage of cloud resources.
Docker Swarm is a popular container orchestration technology that makes containerized application administration easier. While Docker Swarm provides strong capabilities for deploying and scaling applications, it’s also critical to monitor and report the performance and health of your Swarm clusters.
Monitoring business KPIs is necessary to make the connection between IT metrics and business outcomes, and business analytics tools can provide these critical IT business metrics. Much has been written about breaking down IT silos through cultural shifts and technology alignment. How do SLO violations impact partner orders?
“Closed loop” refers to the continuous feedback loop in which the system takes actions — based on monitoring and analysis — and verifies the results to ensure complete problem remediation. By continuously monitoring and verifying closed-loop remediation, teams can expect to reduce both their change failure and incident escalation rates.
They discussed bestpractices, emerging trends, effective mindsets for establishing service-level objectives (SLOs) , and more. At times, engineering teams can become preoccupied with the minutiae of technological endeavors and lose sight of overall business goals. Download now!
In recent years, the term MLOps has become a buzzword in the world of AI, often discussed in the context of tools and technology. There is often a lack of discussion around the operations needed for machine learning (ML) in production and monitoring specifically.
Cloud security monitoring is key—identifying threats in real-time and mitigating risks before they escalate. This article strips away the complexities, walking you through bestpractices, top tools, and strategies you’ll need for a well-defended cloud infrastructure. What does it take to secure your cloud assets effectively?
Monitoring and observability are important topics for any developer, architect, or Site Reliability Engineer (SRE), and this holds true independent of the language or runtime of choice. Stephan walks us through the steps and some bestpractices to get automated observability into your apps using Dynatrace. Dynatrace news.
Having released this functionality in a Preview Release back in May 2019, we’re now happy to announce the General Availability of our SAP ABAP monitoring extension. Why SAP ABAP platform monitoring in Dynatrace? What is ABAP platform monitoring? Monitoring is purely remote and implemented using public SAP ABAP interfaces.
This is especially true because of the distributed and dynamic nature of cloud-native apps, which are often deployed using ephemeral technologies like containers and serverless functions. This post discusses what we consider to be some of the bestpractices and standards to follow when logging and monitoring cloud-native applications.
We’re proud to announce the Early Access Program (EAP) for monitoring of SAP ABAP performance from the infrastructure and ABAP application platform perspective. Why SAP ABAP platform monitoring in Dynatrace? What is ABAP platform monitoring? Monitoring is purely remote and implemented using public SAP ABAP interfaces.
Recently, Dynatrace added OpenTelemetry support to its PurePath 4 technology, which is its fourth and latest generation of automatic and intelligent distributed tracing. Configuring monitoring and observability is no stranger to that paradigm and it was also highlighted in the latest State of DevOps 2020 report.
Nowadays, many performance testers with many years of experience in IT have a lot of confusion and are still confused about the technologies they worked with and were used in their projects for years. and must have extensive experience in specialized skills. and must have extensive experience in specialized skills.
Unifying observability and security not only helps save significant time and effort, it also provides the necessary visibility into the organization’s IT environment and helps to achieve continuous compliance , said Bernd Greifeneder, Founder and Chief Technology Officer, Dynatrace.
Moving media into the cloud introduces new challenges for production and post ramping up to meet the operational and technological hurdles this poses. Depending on the market, or production budget, cutting-edge technology might not be available or affordable.
Effectively assessing and mitigating these external risks requires robust vendor due diligence and continuous monitoring of their cybersecurity posture. Implementing and maintaining DORA compliance can be resource-intensive, requiring skilled personnel, advanced technologies, and ongoing investment. Resource constraints.
The latest State of Observability 2024 report shows that 86% of interviewed technology leaders see an explosion of data beyond humans’ ability to manage it. Monitor your cloud OpenPipeline ™ is the Dynatrace platform data-handling solution designed to seamlessly ingest and process data from any source, regardless of scale or format.
As software development environments adopt more cloud-native technologies, microservices, and container-based architecture, delivering software manually becomes increasingly impractical. Bestpractices for adopting continuous delivery. Here are some bestpractices to consider for automating delivery effectively.
DevSecOps initiatives aren’t rooted in a specific technology. Companies can choose whatever combination of infrastructure, platforms, and software will help them best achieve continuous integration and continuous delivery (CI/CD) of new apps and services while simultaneously baking in security measures. What is DevSecOps?
This complex web of interconnected technologies across a containerized environment introduces various challenges related to visibility, resource utilization, security, orchestration, and collaboration. Monitoring-as-code can also be configured in GitOps fashion. Open source logs and metrics take precedence in the monitoring process.
My goal is always to deliver tangible bestpractices that can be implemented today, and that can help teams transform their organization to true software-centric, digital cloud-native businesses. Democratizing data – monitoring-as-a-self-service for biz, dev and ops. How to transform into a NoOps organization.
ACM is the culmination of our bestpractices and learning that we share every day with our customers to help them automate their enterprise, innovate faster, and deliver better business ROI. Cloud native” is not just architecture; it also means bringing cloud-centric bestpractices to software and IT generally.
Leverage OneAgent functionality Ingesting configuration changes into Dynatrace through the events API call and utilizing OneAgent to detect configuration changes for supported technologies help maintain close alignment between your staging and production environments. This approach effectively combats configuration drift.
Also called continuous monitoring or synthetic monitoring , synthetic testing mimics actual users’ behaviors to help companies identify and remediate potential availability and performance issues. Users often interact with technologies in unpredictable ways that could reveal previously unknown issues. HTTP monitors.
Because all these resources generate huge amounts of data in various locations, it makes it difficult to monitor. These challenges make Azure observability critical for building and monitoring cloud-native applications. One of the key monitoring strategies in the Cloud Adoption Framework is observability.
The IDC FutureScape: Worldwide IT Industry 2020 Predictions highlights key trends for IT industry-wide technology adoption for the next five years and includes these predictions: Hasten to innovation. By 2024, over 50% of all IT spending will be directly put towards digital transformation and innovation (up from 31% in 2018).
To solve this problem , Dynatrace offers a fully automated approach to infrastructure and application observability including Kubernetes control plane, deployments, pods, nodes, and a wide array of cloud-native technologies. Embracing cloud native bestpractices to increase automation. Monitoring such an application is easy.
Unlike traditional monitoring, which focuses on watching individual metrics for system health indicators with no overall context, observability goes deeper , analyzing telemetry data for a comprehensive view of the system’s internal state in context of the wider system. There are three main types of telemetry data: Metrics.
As organizations strive for observability and data democratization, OpenTelemetry emerges as a key technology to create and transfer observability data. Before we get into the specifics, let’s first recap the benefits OpenTelemetry offers and why using collectors is a bestpractice.
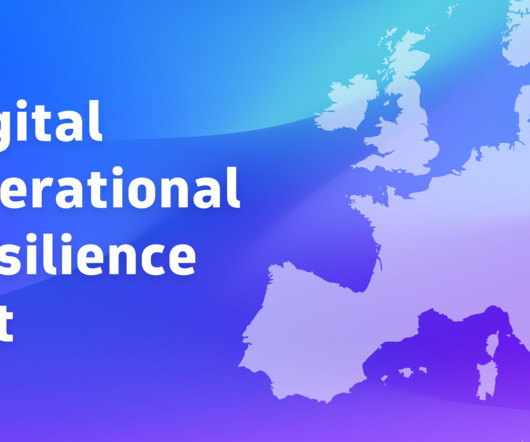
The regulation comprehensively addresses Information Communication Technology (ICT) risk management, harmonizing cybersecurity guidelines across the financial sector while considering the ever-evolving threat landscape. DORA came into effect on January 16, 2023. Establishing DORA contractual requirements.
In this blog post, we’ll discuss the methods we used to ensure a successful launch, including: How we tested the system Netflix technologies involved Bestpractices we developed Realistic Test Traffic Netflix traffic ebbs and flows throughout the day in a sinusoidal pattern. Basic with ads was launched worldwide on November 3rd.
Monitoring SAP products can present challenges Monitoring SAP systems can be challenging due to the inherent complexity of using different technologies—such as ABAP, Java, and cloud offerings—and the sheer amount of generated data. SAP Basis teams have established bestpractices for managing their SAP systems.
As organizations adopt microservices architecture with cloud-native technologies such as Microsoft Azure , many quickly notice an increase in operational complexity. Most monitoring tools for migrations, development, and operations focus on collecting and aggregating the three pillars of observability— metrics, traces, and logs.
They now use modern observability to monitor expanding cloud environments in order to operate more efficiently, innovate faster and more securely, and to deliver consistently better business results. See how Dynatrace Log Management and Analytics enables any analysis at any time with Grail technology. Learn more. What is IT automation?
We organize all of the trending information in your field so you don't have to. Join 5,000+ users and stay up to date on the latest articles your peers are reading.
You know about us, now we want to get to know you!
Let's personalize your content
Let's get even more personalized
We recognize your account from another site in our network, please click 'Send Email' below to continue with verifying your account and setting a password.


Let's personalize your content