This site uses cookies to improve your experience. To help us insure we adhere to various privacy regulations, please select your country/region of residence. If you do not select a country, we will assume you are from the United States. Select your Cookie Settings or view our Privacy Policy and Terms of Use.
Cookie Settings
Cookies and similar technologies are used on this website for proper function of the website, for tracking performance analytics and for marketing purposes. We and some of our third-party providers may use cookie data for various purposes. Please review the cookie settings below and choose your preference.
Used for the proper function of the website
Used for monitoring website traffic and interactions
Cookie Settings
Cookies and similar technologies are used on this website for proper function of the website, for tracking performance analytics and for marketing purposes. We and some of our third-party providers may use cookie data for various purposes. Please review the cookie settings below and choose your preference.
Strictly Necessary: Used for the proper function of the website
Performance/Analytics: Used for monitoring website traffic and interactions
Every CD pipeline is unique to the organization it serves, and varies according to architectures, computing environments, tool sets, and corporate, industry, and regulatory requirements. Here are a few common metrics teams should track for every CD pipeline to help you evaluate its efficacy. Develop Service Level Objectives (SLOs).
Let me walk you through how I have built my Dynatrace Performance Insights Dashboard showing SLIs split by Test Name as well as SLIs for the specific technology and infrastructure: Enriching your load testing scripts with meta data allows building test context specific SLI-dashboards in Dynatrace.
Install the Dynatrace OneAgent to gather metrics and feed the Dynatrace AI-powered problem causation engine that automatically shows impacted users, system, and root cause during testing. Check out Dynatrace’s Load testingtool integration. Triage and Optimize many out of the box diagnostic tools.
Also called continuous monitoring or synthetic monitoring , synthetic testing mimics actual users’ behaviors to help companies identify and remediate potential availability and performance issues. Availability testing Availability testing helps organizations confirm that a site or application is responding to user requests.
My goal is always to deliver tangible bestpractices that can be implemented today, and that can help teams transform their organization to true software-centric, digital cloud-native businesses. Chef, Puppet, Ansible), or delivery tools (e.g. A game-changing two days of enhancing business and IT performance.
Our solution to modernize this legacy approach is an approach we call white box testing. In white-box testing, we combine open-source load testingtools such as JMeter with Dynatrace’s observability and analytics capabilities. from other testtools or real users). Leveraging the W3C Trace context header.
Before you begin tuning your website or application, you must first figure out which metrics matter most to your users and establish some achievable benchmarks. What is Performance Testing? For example, you can use load testingtools to see how your application performs with a certain number of simultaneous users.
Gone are the days for Christian manually looking at dashboards and metrics after a new build got deployed into a testing or acceptance environment: Integrating Keptn into your existing DevOps tools such as GitLab is just a matter of an API call. A popular use case of Keptn is the SLI/SLO-based Quality Gate capability.
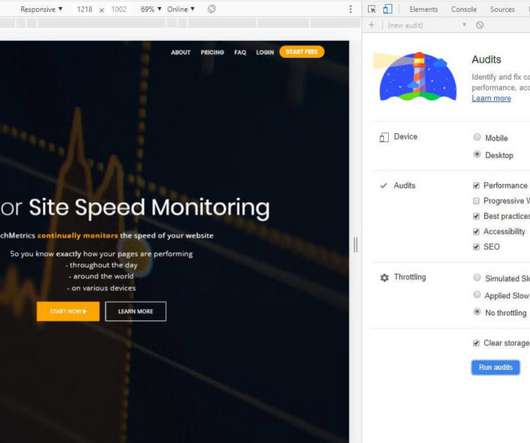
You can use it through the Chrome Dev tools, through the command line, or as a Node module if you really want to get your hands dirty. It offers audits for bestpractices, accessibility, progressive web apps, SEO and of course, performance. Let’s take a look at how to get the most out of this powerful tool.
The Web Performance Guide is – as its name suggests – a collection of articles we've been writing over the years to answer the most common questions we field about performance topics like site speed, why it matters, how it's measured, website monitoring tools, metrics, analytics, and optimization techniques.
Without a crystal clear understanding of the processes when a team works on a software product, it can be tempting to think that all the problems stem from under-qualified QA engineers who click around randomly and ruin the hard work of the whole team.
Implementing SEO bestpractice doesn’t just give you the best chance possible of ranking well in search engines; it makes your websites better by scrutinizing quality, design, accessibility, and speed, among other things. Following bestpractice usually means a better website, more organic traffic, and happier visitors.
There are many key performance indicators (KPI) that measure different points during the lifecycle of the web page (such as TTFB, domInteractive and onload ), but these metrics don’t reflect how the end-user experiences the page. We found out user-centric performance metrics to be the perfect fit for this purpose. Large preview ).
Running speed tests with tools like Google PageSpeed Insights , WebPageTest , or KeyCDN’s Website Speed Test are always a good way to help gauge your website’s performance. While these metrics can be very helpful it is also important to keep this data in perspective.
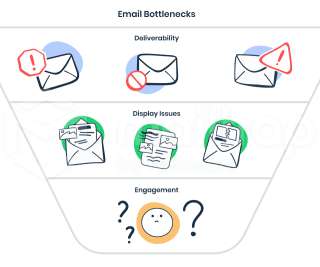
It is recommended to follow rules and bestpractices of building and sending emails. With this article, you will enhance your testing workflows by covering all the important aspects, and saving time and stress with suitable email testing methods and tools. Are You Keeping On Top Of Your Email Metrics?
WebPageTest is one of the few web performance testingtools that actually tests a reload of the page using a primed HTTP Cache — most of the other tools just flag if your HTTP resources are not explicitly set to be cached. 400 pages , jam-packed with in-depth user research and bestpractices.
So noticeable, in fact, that Core Web Vitals has a metric all about it called Largest Contentful Paint (LCP). This metric measures the time it takes, in seconds, to render the largest image or text block that is visible on the initial load. We can test for LCP in a number of ways. And most of all, we need to care.
The good news is there are website monitoring tools specially designed to solve this problem. You may start your diagnosis from our free speed testtool , and no sign up is required. For this article, we ran a speed test for the TED website as the target website. BestPractices.
The good news is there are website monitoring tools specially designed to solve this problem. You may start your diagnosis from our free speed testtool , and no sign up is required. For this article, we ran a speed test for the TED website as the target website. BestPractices.
The good news is there are website monitoring tools specially designed to solve this problem. You may start your diagnosis from our free speed testtool , and no sign up is required. For this article, we ran a speed test for the TED website as the target website. BestPractices.
At a minimum, Optimal recommends that you have RUM, APM, synthetic, and load testtools set up, instrumented, and producing meaningful data. Review OWASP’s recommendations and bestpractices with your developers. Are they providing meaningful, actionable data? STEP 7: Tune Your CDN Performance.
You would, however, be hard-pressed even today to find a good article that details the nuanced bestpractices. This is because, as I stated in the introduction to part 1 , much of the early HTTP/2 content was overly optimistic about how well it would work in practice, and some of it, quite frankly, had major mistakes and bad advice.
Web pages are unbelievably complex, and there are hundreds of different metrics available to track. A performance budget is a threshold that you apply to the metrics you care about the most. This is when you run into three important questions: Which metrics should you focus on? Which metrics should you focus on?
LogRocket tracks key metrics, incl. Getting Ready: Planning And Metrics Performance culture, Core Web Vitals, performance profiles, CrUX, Lighthouse, FID, TTI, CLS, devices. Getting Ready: Planning And Metrics. DOM complete, time to first byte, first input delay, client CPU and memory usage. Get a free trial of LogRocket today.
Getting Ready: Planning And Metrics. Testing And Monitoring. Getting Ready: Planning And Metrics. You need a business stakeholder buy-in, and to get it, you need to establish a case study on how speed benefits metrics and Key Performance Indicators ( KPIs ) they care about. Table Of Contents. Setting Realistic Goals.
Getting Ready: Planning And Metrics. Testing And Monitoring. Getting Ready: Planning And Metrics. You need a business stakeholder buy-in, and to get it, you need to establish a case study, or a proof of concept using the Performance API on how speed benefits metrics and Key Performance Indicators ( KPIs ) they care about.
If you're scrambling to optimize your site before Black Friday, you still have time to implement some or all of these bestpractices. Real user monitoring (RUM) can sometimes be harder to implement on short notice compared to synthetic tools. Google Tag Manager) or A/B testingtool if you need to circumvent code changes.
We organize all of the trending information in your field so you don't have to. Join 5,000+ users and stay up to date on the latest articles your peers are reading.
You know about us, now we want to get to know you!
Let's personalize your content
Let's get even more personalized
We recognize your account from another site in our network, please click 'Send Email' below to continue with verifying your account and setting a password.


Let's personalize your content