This site uses cookies to improve your experience. To help us insure we adhere to various privacy regulations, please select your country/region of residence. If you do not select a country, we will assume you are from the United States. Select your Cookie Settings or view our Privacy Policy and Terms of Use.
Cookie Settings
Cookies and similar technologies are used on this website for proper function of the website, for tracking performance analytics and for marketing purposes. We and some of our third-party providers may use cookie data for various purposes. Please review the cookie settings below and choose your preference.
Used for the proper function of the website
Used for monitoring website traffic and interactions
Cookie Settings
Cookies and similar technologies are used on this website for proper function of the website, for tracking performance analytics and for marketing purposes. We and some of our third-party providers may use cookie data for various purposes. Please review the cookie settings below and choose your preference.
Strictly Necessary: Used for the proper function of the website
Performance/Analytics: Used for monitoring website traffic and interactions
This guide will cover how to distribute workloads across multiple nodes, set up efficient clustering, and implement robust load-balancing techniques. However, maintaining the health of each RabbitMQ node is crucial; monitoring tools play a vital role in ensuring the stability of the RabbitMQ cluster.
Digital experience monitoring (DEM) is crucial for organizations to meet this demand and succeed in today’s competitive digital economy. DEM solutions monitor and analyze the quality of digital experiences for users across digital channels. This allows ITOps to measure each user journey’s effectiveness and efficiency.
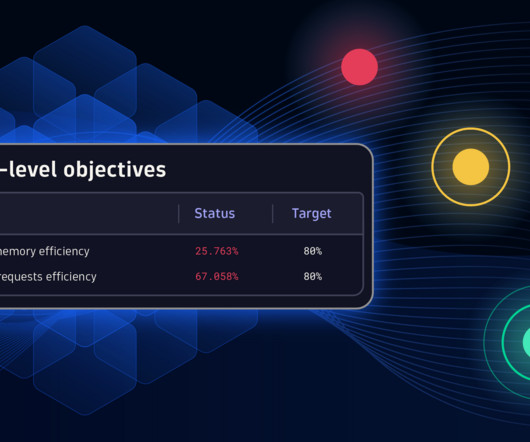
A good Kubernetes SLO strategy helps teams manage and make containerized workloads more efficient. Service-level objectives are typically used to monitor business-critical services and applications. This feature is valuable for platform owners who want to monitor and optimize their Kubernetes environment.
Why manual audits and custom scripts fall short for Kubernetes security posture management In the dynamic and complex world of Kubernetes, relying on manual audits, custom scripts, and general-purpose security tools is no longer enough to achieve efficient security posture management. Here’s why: Misconfigurations are pervasive.
These innovations promise to streamline operations, boost efficiency, and offer deeper insights for enterprises using AWS services. By automating OneAgent deployment at the image creation stage, organizations can immediately equip every EC2 instance with real-time monitoring and AI-powered analytics.
As a MISA member, we look forward to collaborating with Microsoft and other members to develop bestpractices, share insights, and drive innovation in cloud-native security. The solution also allows customers to combine alerts from best-in-class security solutions. Runtime application protection.
By following key log analytics and log management bestpractices, teams can get more business value from their data. Challenges driving the need for log analytics and log management bestpractices As organizations undergo digital transformation and adopt more cloud computing techniques, data volume is proliferating.
Cost optimization: Immediate responses to tag changes lead to informed decisions about scaling, shutting down unused instances, or fine-tuning resource efficiency. Proactive site reliability: Automated guardians can monitor the four golden signals , enabling proactive reliability measures. Now, let’s get started with the setup!
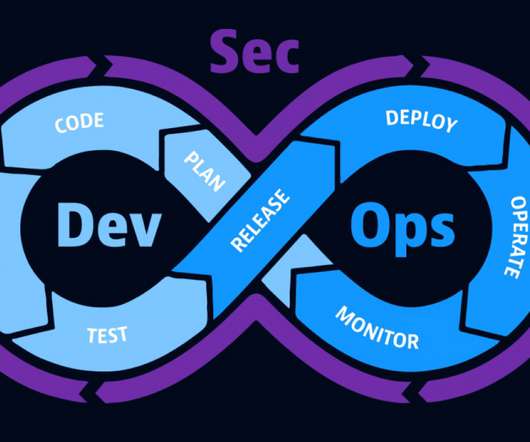
A DevSecOps approach advances the maturity of DevOps practices by incorporating security considerations into every stage of the process, from development to deployment. There are a few key bestpractices to keep in mind that formulate the perfect DevSecOps maturity model. The education of employees about security awareness.
Taking those into account and understanding how we use Dynatrace for self-monitoring, our analysis suggests that using unified observability and security from Dynatrace can lead to saving up to 50% – 70% of the effort required to manage DORA compliance.
Empowering teams to manage their FinOps practices, however, requires teams to have access to reliable multicloud monitoring and analysis data. It provides visibility, accountability, and optimization opportunities within the context of observability practices in cloud computing environments.
Today, the composable nature of code enables skilled IT teams to create and customize automated solutions capable of improving efficiency. Here, we’ll tackle the basics, benefits, and bestpractices of IAC, as well as choosing infrastructure-as-code tools for your organization. Exploring IAC bestpractices.
Because cyberattacks are increasing as application delivery gets more complex, it is crucial to put in place some cybersecurity bestpractices to protect your organization’s data and privacy. You can achieve this through a few bestpractices and tools. Application security monitoring. What does that mean?
Costs and their origin are transparent, and teams are fully accountable for the efficient usage of cloud resources. This granular level of transparency helps identify cost drivers, monitor usage patterns, and uncover opportunities for cost savings. Figure 4: Set up an anomaly detector for peak cost events.
Organizations are now looking into solutions that unify security capabilities to protect their environments efficiently. CSPM solutions continuously monitor and improve the security posture of Infrastructure-as-a-Service (IaaS) and Platform-as-a-Service (PaaS) environments. Also evaluates the potential impact of security risks.
With the increasing frequency of cyberattacks, it is imperative to institute a set of cybersecurity bestpractices that safeguard your organization’s data and privacy. Continuously monitoring your runtime environments for vulnerabilities will also reveal security issues that may have only shown themselves during production.
In fact, according to a Dynatrace global survey of 1,300 CIOs , 99% of enterprises utilize a multicloud environment and seven cloud monitoring solutions on average. What is cloud monitoring? Cloud monitoring is a set of solutions and practices used to observe, measure, analyze, and manage the health of cloud-based IT infrastructure.
They now use modern observability to monitor expanding cloud environments in order to operate more efficiently, innovate faster and more securely, and to deliver consistently better business results. Further, automation has become a core strategy as organizations migrate to and operate in the cloud.
They discussed bestpractices, emerging trends, effective mindsets for establishing service-level objectives (SLOs) , and more. The panelists speculated that AI will likely improve quality of life for SRE teams through its ability to efficiently execute tasks. This accessibility results in reduced MTTR and improved productivity.
Monitoring business KPIs is necessary to make the connection between IT metrics and business outcomes, and business analytics tools can provide these critical IT business metrics. Complementing domain specialists with generalists is one such cultural shift reflective of the dynamic and interconnected nature of modern monitoring platforms.
Finally, the best information is still useless if users can’t retrieve it quickly when needed and use it accordingly. How to efficiently introduce team ownerships Dynatrace provides different ways of associating team ownership with entities and adding desired team metadata, such as contact details, to your environments.
With Dashboards , you can monitor business performance, user interactions, security vulnerabilities, IT infrastructure health, and so much more, all in real time. Follow along to create this host monitoring dashboard We will create a basic Host Monitoring dashboard in just a few minutes. Create a new dashboard.
Cloud security monitoring is key—identifying threats in real-time and mitigating risks before they escalate. This article strips away the complexities, walking you through bestpractices, top tools, and strategies you’ll need for a well-defended cloud infrastructure. What does it take to secure your cloud assets effectively?
Tools for cost optimization monitoring are now essential aids in this endeavor. In this article, we will explore the benefits, features, and bestpractices associated with cost-optimization monitoring tools.
With so much flux and complexity across a cloud-native system, it's important to have robust monitoring and logging in place to control and manage the inevitable chaos. This post discusses what we consider to be some of the bestpractices and standards to follow when logging and monitoring cloud-native applications.
With this integration, Dynatrace customers can now leverage Terraform to manage their monitoring infrastructure as code,” said Asad Ali, Senior Director of Sales Engineering at Dynatrace. What is monitoring as code? What are the benefits of monitoring as code? across their complete Dynatrace instance.”.
Fast and efficient log analysis is critical in todays data-driven IT environments. For enterprises managing complex systems and vast datasets using traditional log management tools, finding specific log entries quickly and efficiently can feel like searching for a needle in a haystack. Watch this scenario in action.
From my experience, a month of monitoring is the optimal duration to gain statistically significant insights into “how my entity behaves with the configured SLO.” Let’s assume we created a service-availability SLO, monitoring the request failure count against the overall request counts. What characterizes a weak SLO?
Building services that adhere to software bestpractices, such as Object-Oriented Programming (OOP), the SOLID principles, and modularization, is crucial to have success at this stage. Implement proactive monitoring for each of these endpoints. The request schema for the observability endpoint. there is a dedicated collector.
Real user monitoring can help you catch these issues before they impact the bottom line. What is real user monitoring? Real user monitoring (RUM) is a performance monitoring process that collects detailed data about a user’s interaction with an application. Real user monitoring collects data on a variety of metrics.
The Dynatrace CSPM solution significantly enhances security, compliance, and resource efficiency through continuous monitoring, automated remediation, and centralized visibility for enterprises managing complex hybrid and multicloud environments. Automation and continuous monitoring. The solution?
Properly monitoring a Kubernetes cluster or any related environment can be difficult. Service-level objectives (SLOs) are often used to monitor business-critical services and applications for customers. However, they can also be used to monitor optimization processes effectively.
By leveraging the power of the Dynatrace ® platform and the new Kubernetes experience, platform engineers are empowered to implement the following bestpractices, thereby enabling their dev teams to deliver best-in-class applications and services to their customers. Monitoring-as-code can also be configured in GitOps fashion.
Key Takeaways Understanding the range of MySQL backup types and strategies is essential for optimal data security and efficiency, including full, incremental, differential, and partial backups, each with its advantages and use cases. Maintaining backup security and integrity requires adherence to bestpractices.
In my previous article about continuous integration and continuous delivery (CI/CD) , I defined CI/CD and explained how these practices work together to help DevOps teams deliver quality software faster. As automation improves quality and efficiency, the simplest result — and perhaps the most noticeable — is getting features to users faster.
Unlike traditional monitoring, which focuses on watching individual metrics for system health indicators with no overall context, observability goes deeper , analyzing telemetry data for a comprehensive view of the system’s internal state in context of the wider system. There are three main types of telemetry data: Metrics.
While DORA emphasizes managing risks associated with some third-party ICT service providers, financial institutions have limited control over security practices of these vendors. Effectively assessing and mitigating these external risks requires robust vendor due diligence and continuous monitoring of their cybersecurity posture.
Operations refers to the processes of managing software functionality throughout its delivery and use life cycle, including monitoring system performance, repairing defects, testing after updates and changes, and tuning the software release system. Operations. The same holds true of DevSecOps initiatives. Challenge accepted.
Our enhanced host monitoring dashboard that highlights disk usage includes AI forecasting for CPU usage. This approach helps you quickly pinpoint potential problems and ensures efficientmonitoring of your infrastructure. By the end of this session, your enhanced dashboard will look like this: Figure 1. Looking for something?
Our new eBook, “ From Planning to Performance: MongoDB Upgrade BestPractices ,” guides you through the entire process to ensure your database’s long-term success. From Planning to Performance: MongoDB Upgrade BestPractices x: Live resharding of databases for uninterrupted sharded key changes.
As organizations turn to artificial intelligence for operational efficiency and product innovation in multicloud environments, they have to balance the benefits with skyrocketing costs associated with AI. An AI observability strategy—which monitors IT system performance and costs—may help organizations achieve that balance.
In the dynamic world of microservices architecture, efficient service communication is the linchpin that keeps the system running smoothly. This dedicated infrastructure layer is designed to cater to service-to-service communication, offering essential features like load balancing, security, monitoring, and resilience.
Monitor your cloud OpenPipeline ™ is the Dynatrace platform data-handling solution designed to seamlessly ingest and process data from any source, regardless of scale or format. Kubernetes log monitoring with Fluent Bit In an effort to further democratize data, Dynatrace provides a curated and supported OpenTelemetry collector.
This is a set of bestpractices and guidelines that help you design and operate reliable, secure, efficient, cost-effective, and sustainable systems in the cloud. The framework comprises six pillars: Operational Excellence, Security, Reliability, Performance Efficiency, Cost Optimization, and Sustainability.
We organize all of the trending information in your field so you don't have to. Join 5,000+ users and stay up to date on the latest articles your peers are reading.
You know about us, now we want to get to know you!
Let's personalize your content
Let's get even more personalized
We recognize your account from another site in our network, please click 'Send Email' below to continue with verifying your account and setting a password.


Let's personalize your content