This site uses cookies to improve your experience. To help us insure we adhere to various privacy regulations, please select your country/region of residence. If you do not select a country, we will assume you are from the United States. Select your Cookie Settings or view our Privacy Policy and Terms of Use.
Cookie Settings
Cookies and similar technologies are used on this website for proper function of the website, for tracking performance analytics and for marketing purposes. We and some of our third-party providers may use cookie data for various purposes. Please review the cookie settings below and choose your preference.
Used for the proper function of the website
Used for monitoring website traffic and interactions
Cookie Settings
Cookies and similar technologies are used on this website for proper function of the website, for tracking performance analytics and for marketing purposes. We and some of our third-party providers may use cookie data for various purposes. Please review the cookie settings below and choose your preference.
Strictly Necessary: Used for the proper function of the website
Performance/Analytics: Used for monitoring website traffic and interactions
Introduction to Message Brokers Message brokers enable applications, services, and systems to communicate by acting as intermediaries between senders and receivers. This decoupling simplifies system architecture and supports scalability in distributed environments.
This article analyzes the correlation between block sizes and their impact on storage performance. This paper deals with definitions and understanding of structured data vs unstructured data, how various storage segments react to block size changes, and differences between I/O-driven and throughput-driven workloads.
Performance Benchmarking of PostgreSQL on ScaleGrid vs. AWS RDS Using Sysbench This article evaluates PostgreSQL’s performance on ScaleGrid and AWS RDS, focusing on versions 13, 14, and 15. This study benchmarks PostgreSQL performance across two leading managed database platforms—ScaleGrid and AWS RDS—using versions 13, 14, and 15.
Traditional analytics and AI systems rely on statistical models to correlate events with possible causes. It removes much of the guesswork of untangling complex system issues and establishes with certainty why a problem occurred. Fragmented and siloed data storage can create inconsistencies and redundancies. Timeliness.
IT infrastructure is the heart of your digital business and connects every area – physical and virtual servers, storage, databases, networks, cloud services. This shift requires infrastructure monitoring to ensure all your components work together across applications, operating systems, storage, servers, virtualization, and more.
which is difficult when troubleshooting distributed systems. Troubleshooting a session in Edgar When we started building Edgar four years ago, there were very few open-source distributed tracing systems that satisfied our needs. Investigating a video streaming failure consists of inspecting all aspects of a member account.
4:45pm-5:45pm NFX 202 A day in the life of a Netflix Engineer Dave Hahn , SRE Engineering Manager Abstract : Netflix is a large, ever-changing ecosystem serving millions of customers across the globe through cloud-based systems and a globally distributed CDN. We explore all the systems necessary to make and stream content from Netflix.
Dynatrace OneAgent deployment and life-cycle management are already widely considered to be industry benchmarks for reliability and efficiency. Easier rollout thanks to log storage best practices. Easier rollout thanks to log storage best practices. Dynatrace news. Advanced customization of OneAgent deployments made easy.
We implemented a batch processing system for users to submit their requests and wait for the system to generate the output. This limited pilot system greatly reduced the time spent by our users to manually analyze the content. Maintaining disparate systems posed a challenge. Processing took several hours to complete.
A Dedicated Log Volume (DLV) is a specialized storage volume designed to house database transaction logs separately from the volume containing the database tables. DLVs are particularly advantageous for databases with large allocated storage, high I/O per second (IOPS) requirements, or latency-sensitive workloads.
Oracle Database is a commercial, proprietary multi-model database management system produced by Oracle Corporation, and the largest relational database management system (RDBMS) in the world. Compare ease of use across compatibility, extensions, tuning, operating systems, languages and support providers. Compare Ease of Use.
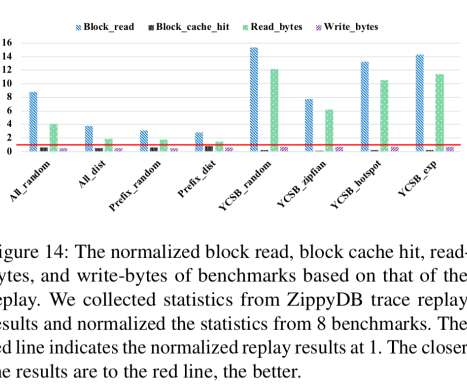
Characterizing, modeling, and benchmarking RocksDB key-value workloads at Facebook , Cao et al., Or in the case of key-value stores, what you benchmark. So if you want to design a system that will offer good real-world performance, it’s really useful to have benchmarks that accurately represent real-world workloads.
Querying the data While it is reasonable to create panels showing real-time load in order to explore better the types of queries that can be run against pg_stat_monitor, it is more practical to copy and query the data into tables after the benchmarking has completed its run. A script executing a benchmarking run: #!/bin/bash
Storage The type of storage and disk used for database servers can have a significant impact on performance and reliability. Operating system Linux is the most common operating system for high-performance MySQL servers. Benchmark before you decide. Transparent huge pages (THP) disabled.
Rather than listing the concepts, function calls, etc, available in Citus, which frankly is a bit boring, I’m going to explore scaling out a database system starting with a single host. And now, execute the benchmark: -- execute the following on the coordinator node pgbench -c 20 -j 3 -T 60 -P 3 pgbench The results are not pretty.
These have inspired me to summarize another performance activity: evaluating benchmark accuracy. Accurate benchmarking rewards engineering investment that actually improves performance, but, unfortunately, inaccurate benchmarking is more common. If the benchmark reported 20k ops/sec, you should ask: why not 40k ops/sec?
4:45pm-5:45pm NFX 202 A day in the life of a Netflix Engineer Dave Hahn , SRE Engineering Manager Abstract : Netflix is a large, ever-changing ecosystem serving millions of customers across the globe through cloud-based systems and a globally distributed CDN. We explore all the systems necessary to make and stream content from Netflix.
4:45pm-5:45pm NFX 202 A day in the life of a Netflix Engineer Dave Hahn , SRE Engineering Manager Abstract : Netflix is a large, ever-changing ecosystem serving millions of customers across the globe through cloud-based systems and a globally distributed CDN. We explore all the systems necessary to make and stream content from Netflix.
Indexing efficiency Monitoring indexing efficiency in MySQL involves analyzing query performance, using EXPLAIN statements, utilizing performance monitoring tools, reviewing error logs, performing regular index maintenance, and benchmarking/testing. This KPI is also directly related to Query Performance and helps improve it.
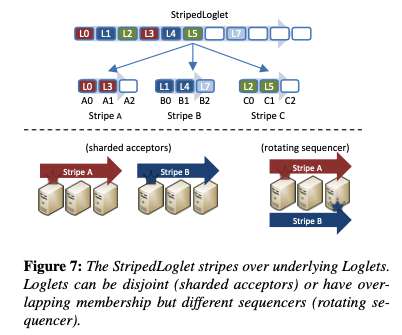
While ultimately this new system should be able to take advantage of the latest advances in consensus for improved performance, that’s not realistic given a 6-9 month in-production target. It’s such a powerful idea that I can imagine distributed systems implementers everywhere adopting it from now on. What does the VirtualLog give us?
Why RPC is “faster” It’s tempting to simply write a micro-benchmark test where we issue 1000 requests to a server over HTTP and then repeat the same test with asynchronous messages. If you did such a benchmark, here’s an incomplete picture you might end up with: Graph of microbenchmark showing RPC is faster than messaging.
PMM2 uses VictoriaMetrics (VM) as its metrics storage engine. Please note that the focus of these tests was around standard metrics gathering and display, we’ll use a future blog post to benchmark some of the more intensive query analytics (QAN) performance numbers.
This article will explore how they handle data storage and scalability, perform in different scenarios, and, most importantly, how these factors influence your choice. It uses a hash table to manage these pairs, divided into fixed-size buckets with linked lists for key-value storage. High data availability is achieved.
Simply put, it’s the set of computational tasks that cloud systems perform, such as hosting databases, enabling collaboration tools, or running compute-intensive algorithms. Such demanding use cases place a great value on systems capable of fast and reliable execution, a need that spans across various industry segments.
Netflix engineers run a series of tests and benchmarks to validate the device across multiple dimensions including compatibility of the device with the Netflix SDK, device performance, audio-video playback quality, license handling, encryption and security. We also provide an API client in Python.
use the TPC-H benchmark to assess Redshift, Redshift Spectrum, Athena, Presto, Hive, and Vertica to find out what works best and the trade-offs involved. We focused on OLAP-oriented parallel data warehouse products available for AWS and restricted our attention to commercially available systems. Key findings. Key findings.
Understanding this DBaaS system might take some adjusting too similar just how traveling on cruises has its tempo which requires us to get used to optimally benefit from what it provides. The great thing about this is that it provides companies with an unprecedented level of freedom when configuring their system.
These have inspired me to summarize another performance activity: evaluating benchmark accuracy. Accurate benchmarking rewards engineering investment that actually improves performance, but, unfortunately, inaccurate benchmarking is more common. If the benchmark reported 20k ops/sec, you should ask: why not 40k ops/sec?
Key metrics like throughput, request latency, and memory utilization are essential for assessing Redis health, with tools like the MONITOR command and Redis-benchmark for latency and throughput analysis and MEMORY USAGE/STATS commands for evaluating memory. It depends upon your application workload and its business logic.
This will be clearly visible in PostgreSQL performance benchmarks as a “ Sawtooth wave ” pattern observed by Vadim in his tests: As we can see, the throughput suddenly drops after every checkpoint due to heavy WAL writing and gradually picks up until the next checkpoint. But this comes with a considerable performance implication.
Fine-grained, secure and efficient data provenance on blockchain systems Ruan et al., That’s hard to do in today’s blockchain systems for two reasons: Provenance can only be determined by querying and replaying all on-chain transactions, which is inefficient and an offline activity. VLDB’19.
Some opinions claim that “Benchmarks are meaningless”, “benchmarks are irrelevant” or “benchmarks are nothing like your real applications” However for others “Benchmarks matter,” as they “account for the processing architecture and speed, memory, storage subsystems and the database engine.”
To illustrate this, I ran the Sysbench-TPCC synthetic benchmark against two different GCP instances running a freshly installed Percona Server for MySQL version 8.0.31 In MySQL, considering the standard storage engine, InnoDB , the data cache is called Buffer Pool. In PostgreSQL, it is called shared buffers.
PostgreSQL is an open source object-relational database system that has soared in popularity over the past 30 years from its active, loyal, and growing community. For the 2nd year in a row, PostgreSQL has kept the title of #1 fastest growing database in the world according to the DBMS of the Year report by the experts at DB-Engines.
Let’s examine the TPC-C Benchmark from this point of view, or more specifically its implementation in Sysbench. The illustrations below are taken from Percona Monitoring and Management (PMM) while running this benchmark. Let’s now look at the operating system level. Analyzing read/write workload by counts.
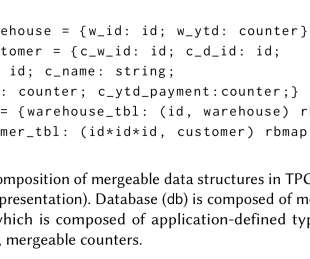
An OCaml compiler extension for generating merge functions, and also for serializing and deserializing data structures for replication, using the third component of Quark… A content-addressable distributed storage abstraction, called the Quark store.
Therefore, before we attempt to measure our database performance, we should know the system or cloud instance to be tested in detail. As database performance is heavily influenced by the performance of storage, network, memory, and processors, we must understand the upper limit of these key components. Operating System: Ubuntu 22.04
This removes the burden of purchasing and maintaining your hardware, storage and networking infrastructure, while still giving you a very familiar experience with Windows and SQL Server itself. You will still have to maintain your operating system, SQL Server and databases just like you would in an on-premises scenario.
Defining high availability In general terms, high availability refers to the continuous operation of a system with little to no interruption to end users in the event of hardware or software failures, power outages, or other disruptions. Some disruption might occur, but it will be minimal. Fault tolerance aims for zero downtime and data loss.
HammerDB is a software application for database benchmarking. HammerDB has graphical and command line interfaces for the Windows and Linux operating systems. Databases are highly sophisticated software, and to design and run a fair benchmark workload is a complex undertaking. Why HammerDB was developed. HammerDB Licensing.
faster access to external storage and data locality (I/O, bandwidth). A recent performance benchmark completed by Intel and BlueData using the BigBench benchmarking kit has shown that the performance ratios for container-based Hadoop workloads on BlueData EPIC are equal to and in some cases, better than bare-metal Hadoop [7].
A 2007 paper, that still has lots to say on the subject of benchmarkingstorage and filesystems. Primarily aimed at researchers and developers, but is relevant to anyone about to embark on a benchmarking effort. A Nine year study of filesystem and storagebenchmarking Download.
If we do that naively though, we’re going to end up with a lot of universes to store and maintain and the storage requirements alone will be prohibitive. Specifically, scalable, parallel streaming dataflow computing systems now support partially-stateful and dynamically-changing dataflows. It runs to about 2,000 lines of Rust.
Backed by Cosmos DB, a fully managed, globally distributed, elastically scaled, pay-as-you-go service, your NServiceBus-based systems can benefit from guaranteed single-digit-millisecond latency with 99.999% availability. How does this compare with Azure Storage Persistence?
We organize all of the trending information in your field so you don't have to. Join 5,000+ users and stay up to date on the latest articles your peers are reading.
You know about us, now we want to get to know you!
Let's personalize your content
Let's get even more personalized
We recognize your account from another site in our network, please click 'Send Email' below to continue with verifying your account and setting a password.


Let's personalize your content